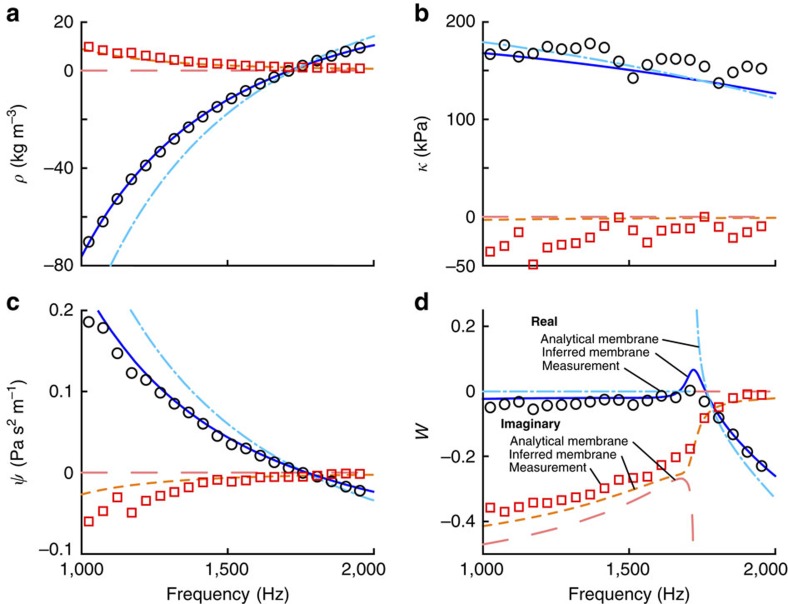
Figure 5. Predicted and measured effective properties of the effective material element.
The effective mass density ρ is shown in a, the bulk modulus κ in b, the Willis coupling coefficient  (
( by reciprocity) in c and the non-dimensional asymmetry coefficient W in d. Two different predictions of the effective material element behaviour are shown based on the mechanical model developed in this work. One uses the analytical approach of Bongard27 for the membrane properties using vendor-supplied material properties as model inputs and the dimensions used in the experimental setup. The real part of that model is indicated by dot-dashed lines and the imaginary part is represented by long-dashed lines. The second prediction is obtained by inferring the membrane parameters from the measured effective density values at 1 kHz and the frequency of zero effective density to get improved estimates of the effective behaviour using the same mechanical model. The real part of that prediction is indicated by solid lines and the imaginary part is represented by short dashed lines. The curve identification for each panel in this figure is the same.

