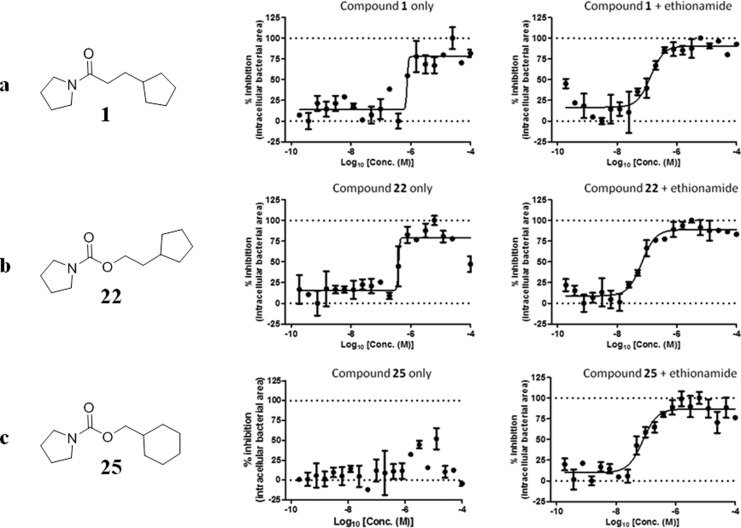
Figure 6.
Inhibition of bacterial replication in macrophages for (a) compound 1, (b) compound 22, (c) compound 25 alone and in the presence of ethionamide (normal MIC/10, experiments have been carried out in triplicate (n = 3)). The parameter used as a read-out was the area of bacteria present per infected macrophage. Normalizations were performed based on the average values obtained for the negative (DMSO 1%) and positive (isoniazid 1 μg/mL) controls. Percentage of inhibition is plotted against the log10 of the compounds concentration, determined in the absence or in the presence of ethionamide at 1/10 of its MIC for the macrophage assay (0.033 μg/mL). Fitting was performed by Prism software using the sigmoidal dose–response (variable slope) model.

