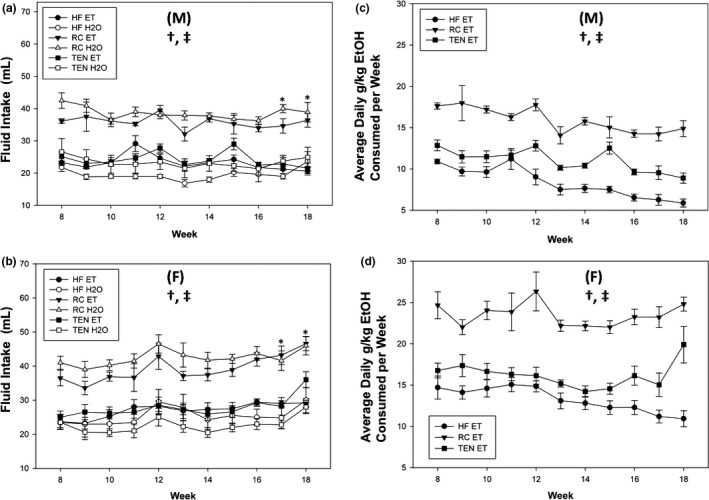
Figure 3.

Alcohol consumption. (a) Alcohol consumed males (mls), (b) alcohol consumed females, (c) g/kg ethanol males, and (d) g/kg ethanol females. Female mice consumed more ethanol in terms of volume and g/kg than male mice. Mice consuming RC exhibited increased g/kg dose of ethanol compared to TEN, which in turn was significantly more than HFD. Circles indicate HFD, triangles indicate RC, and squares indicate TEN. Open circles indicate water, and filled circles indicate alcohol. (M) and (F) refer to male and female graphs, respectively. * significant pairwise difference between male and female ethanol consumption, † significant diet difference, ‡ significant sex difference at p < .05
