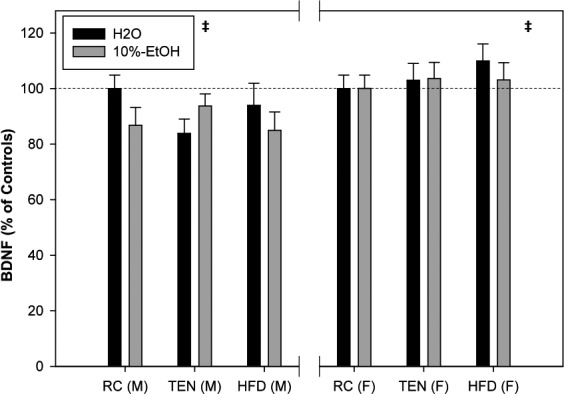
Figure 6.

Whole‐brain BDNF. When normalized to their respective sex controls, males overall exhibited small but significant decreases to BDNF compared to females. Black bars indicate water, and gray bars indicate 10% EtOH. The dashed line indicates 100% RC H2O expression. ‡ significant sex difference at p < .05
