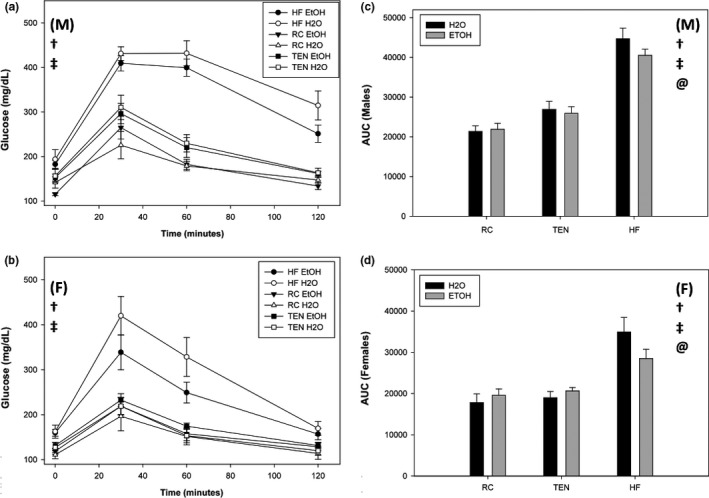
Figure 7.

Glucose tolerance. (a) Glucose over time males, (b) glucose over time females, (c) area under the curve males, and (d) area under the curve females. When consuming HFD, males exhibited worse fasting glucose and glucose tolerance than females. Additionally, mice consuming both HFD and ethanol had improved glucose tolerance than mice consuming HFD and water regardless of sex, but ethanol had no effect on mice consuming RC or TEN. Circles indicate HFD, triangles indicate RC, and squares indicate TEN. Open circles indicate water, and filled circles indicate alcohol. Black bars indicate males, and gray bars indicate females. (M) and (F) refer to male and female graphs, respectively. † significant diet difference, @ significant alcohol difference, ‡ significant sex difference, at p < .05
