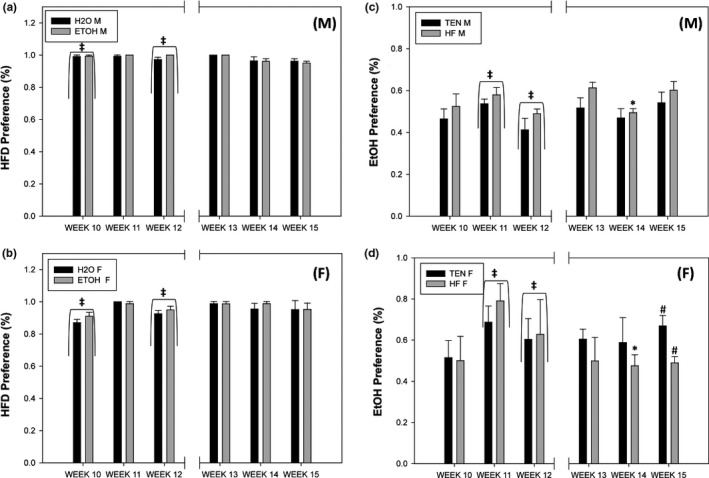
Figure 9.

Diet and alcohol preferences. (a) HFD preference males, (b) HFD preference females, (c) ethanol preference males, and (d) ethanol preference females. Initially, females exhibited reduced HFD preference compared to males, but females increased their preference over time. Alcohol produced no effect on HFD preference. Alcohol preference was elevated in female mice compared to male mice, but male and female preference equalized as the experiment continued. The addition of HFD produced a significant reduction in alcohol preference for females during Week 14 and a moderate reduction in Week 15; males were unaffected by HFD appearance. Left side of the graph indicates before the addition of the new diet or liquid (weeks 10–12), while the right side (weeks 13–15) indicates the preferences after. (M) and (F) refer to male and female graphs, respectively. * significant pairwise difference, ‡ significant sex difference at p < .05; # pairwise difference at p = .069
