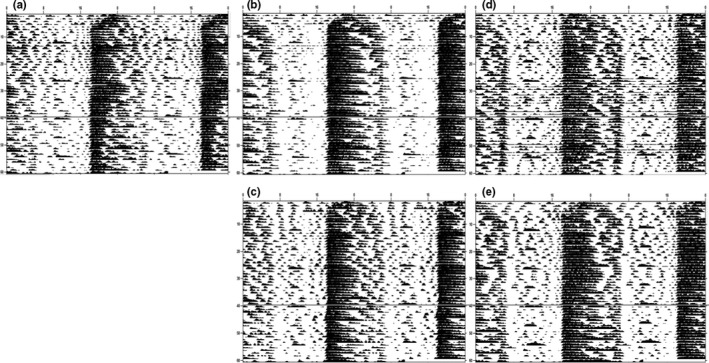
Figure 11.

Female Actograms. (a) RC H2O (b) HFD/RC H2O (c) HFD/RC 10% EtOH (d) TEN H2O/10% EtOH (e) HFD H2O/10% EtOH. Representative actograms for each of the five treatment groups. The dashed line indicates when the food or drink switch occurred for the before and after analysis
