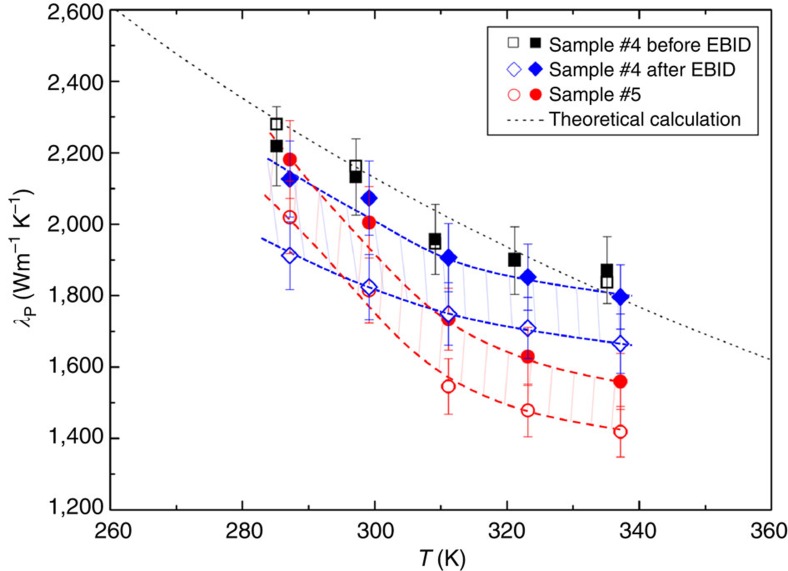
Figure 6. Thermal conductivities of the last two graphene samples.
The thermal conductivity of sample #4 was measured before and after depositing nanoparticles by electron beam induced deposition (EBID). Before EBID, the measured thermal conductivity of sample #4 was almost the same in two opposite heat flux directions (solid and open black symbols). After EBID, the thermal conductivity was 10% larger in the direction from the clean region to the nanoparticle deposition region (blue solid symbols) than that in the opposite direction (blue open symbols). For the sample #5, the thermal conductivity was 11% larger in the direction from the wide region to the narrow region (red solid symbols) than that in the opposite direction (red open symbols). Same as Fig. 3, 5% error bars are plotted in the figure. The heat flux direction with larger thermal conductivity is indicated by the red arrows in Fig. 5. The hatched areas highlight the difference in the thermal conductivity caused by the thermal rectification.

