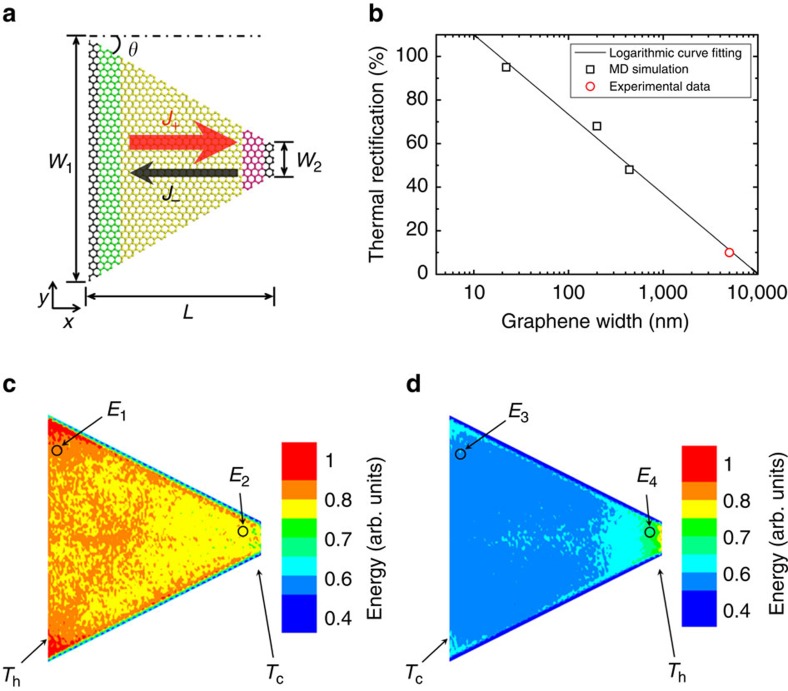
Figure 7. Thermal rectification of the trapezoid graphene analysed by MD simulation.
(a) Schematic picture of the trapezoid graphene. The angle θ=30° is close to that of the graphene sample #5. The big red arrow (plus direction J+) indicates the direction with higher thermal conductivity, while the opposite direction (minus direction J-) has lower thermal conductivity. (b) The thermal rectification ratio versus the graphene width W1 (angle θ is constant). The logarithmic curve-fitting gives y=−15.893 ln(x)+146.609 with R2=0.989. (c) Spatial energy distribution for the plus direction. (d) Spatial energy distribution for the minus direction. Here Th and Tc denotes the high and low temperatures at two ends of graphene, and the spatial energy distribution includes those propagating phonon modes with the participation ratio larger than 0.4. The simulation results confirm that E4<E1, E3<E2, that is, local energy E of propagating modes is always smaller in case (d) than that in case (c) at both high-temperature and low-temperature ends.

