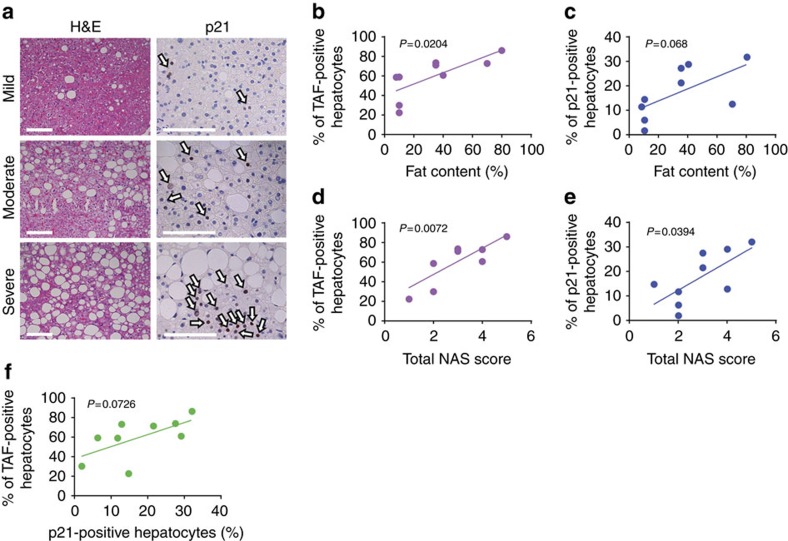
Figure 6. Markers of hepatocyte senescence correlate with severity of NAFLD.
(a) Representative images showing H&E and p21 immunohistochemistry in patients with mild, moderate and severe NAFLD (arrows indicate p21-positive cells (brown), blue=haematoxylin, scale bar, 100 μm). Mean frequencies of (b) TAF (R2=0.5596) and (c) p21-positive hepatocytes per patient increase with the liver fat content in NAFLD patients (R2=0.3991). Frequencies of (d) TAF (R2=0.6668) and (e) p21-positive hepatocytes correlate with the NAS score of NAFLD patients (R2=0.4769). (f) Frequencies of TAF-positive hepatocytes correlate weakly with the frequencies of p21-positive hepatocytes per patient (R2=0.3893). All data are means (frequencies of TAF+ and p21+ cells, fat content) or scores per patient, n=9.

