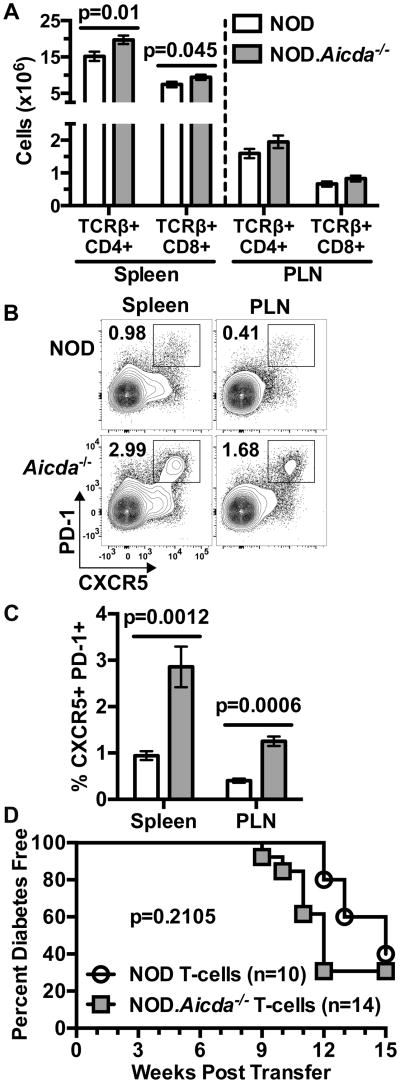
Figure 3. Numbers of total peripheral and GC phenotype CD4+ T-cells are increased in NOD.Aicda-/- mice.
(A) Yields of splenic or PLN resident CD4 (CD45.1+ TCRβ+ CD4+) and CD8 (CD45.1+ TCRβ+ CD8+) T-cells in 7-10 week old female NOD (n=19) and NOD.Aicda-/- (n=21) mice pooled from four experiments. (B) Representative flow cytometric contour plots showing single-cell live CD4 T-cell gated events for analysis of splenic and PLN full Tfh cells (CXCR5+ PD-1+) in 7 week old female mice with quantitative data (n=7 per group) summarized in (C), one representative of three experiments. (D) T1D development in NOD-scid recipients injected with 2.5×10⁶ purified T-cells from 7-8 week old female NOD.Aicda-/- or NOD mice. All p-values for bar graphs were calculated using Mann-Whitney analysis. All bar graphs show Mean±SEM. T1D incidence p-value was calculated using Mantel-Cox analysis.

