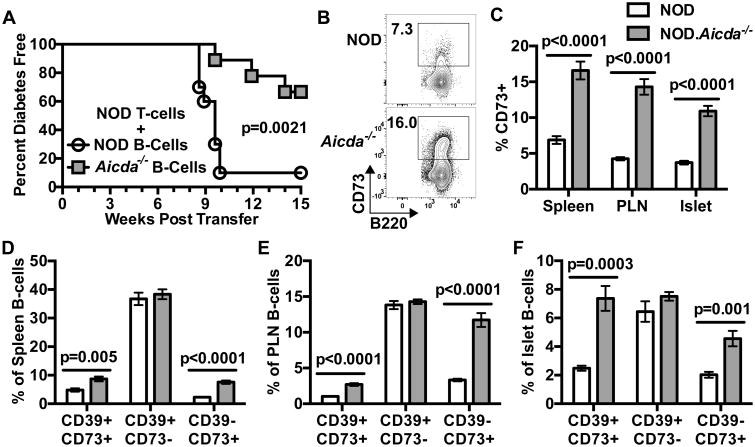
Figure 4. NOD T-cells adoptively transfer T1D less efficiently in the presence of Aicda deficient B-lymphocytes characterized by an expansion of the CD73+ subset.
(A) T1D development in NOD-scid recipients injected with 2.5×10⁶ purified T-cells from 7-8 week-old female NOD donors admixed with 2.5×10⁶ B-lymphocytes from 7-8 week-old NOD (n=10) or NOD.Aicda-/- mice (n=9). (B) Representative contour plots for B220 vs CD73 staining pattern of splenic B220+ CD19+ B-lymphocytes from female NOD and NOD.Aicda-/- mice. (C) Quantification of %CD73+ among spleen, PLN and islet B-lymphocytes in 7-12 week old NOD (spleen/PLN: n=15, Islets: n=18) and NOD.Aicda-/- (spleen/ PLN: n=17, islets: n=16) mice. Spleen and PLN data is pooled from three experiments, islet data is pooled from five experiments. Quantification of the %CD39+ CD73+, CD39+ CD73-, CD39- CD73+ expressing cells amongst (D) splenic (E) PLN or (F) islet B220+ CD19+ B-lymphocytes in 7-12 week old female NOD (spleen/PLN: n=15, islets: n=7) and NOD.Aicda-/- mice (spleen/PLN: n=17, islets: n=8) pooled from two individual experiments. T1D incidence study p-value was calculated using Mantel-Cox analysis. All bar graph p-values were calculated using Mann-Whitney analysis, and all bar graphs show Mean±SEM.

