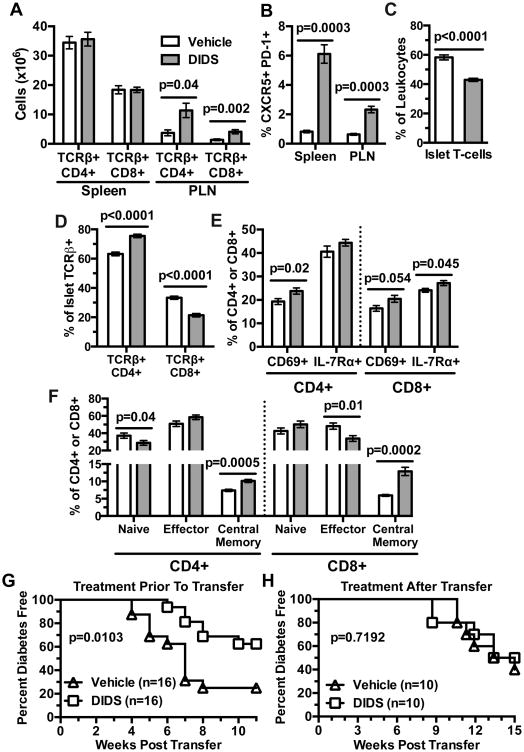
Figure 9. DIDS effects on B-lymphocytes indirectly suppresses diabetogenic T cell responses.
NOD females were treated weekly with 50 mg/kg DIDS or vehicle from 8-16 weeks of age. (A) Percentage of CD4+ and CD8+ T-cells amongst live TER-119- splenic or PLN resident leukocytes (non-red blood cells) (n=7 Vehicle, n=8 DIDS; combined from two experiments). (B) Quantification of percent full Tfh cells amongst CD4+ TCRβ+ cells in the spleen and PLN (n=7 Vehicle, n=8 DIDS; combined from two experiments). (C) Percent TCRβ+ amongst CD45.1+ cells within the islets. (D) Percent CD4+ or CD8+ amongst islet T-cells (n=13 Vehicle, n=14 DIDS; combined from two experiments). (E) Percent CD69+ and IL-7Rα+ amongst islet CD4+ and CD8+ T-cells (n=13 Vehicle, n=14 DIDS; combined from two experiments). (F) Percent Naïve (CD44- CD62L+), Effector (CD44+ CD62L-), and Central Memory (CD44+ CD62L+) CD4+ and CD8+ T-cells in the islets of DIDS or vehicle treated mice (n=13 Vehicle, n=14 DIDS; combined from two experiments). (G) Female NOD mice were injected with vehicle or 50 mg/kg DIDS from 8-16 weeks of age. Splenic T-cells were then purified from each treatment group and transferred at a dose of 3×10⁶ into NOD-scid recipients (n=16 per group) that were subsequently monitored for T1D development. (H) 2.5×10⁶ purified total T-lymphocytes from 6-week-old female NOD mice were transferred into NOD-scid mice which then began weekly treatment with 0 or 50 mg/kg DIDS (n=10 per group) and monitored to T1D. Incidence study p-values were calculated using Mantel-Cox analysis; Mann-Whitney analysis was performed for all bar graphs. All bar graphs show Mean±SEM.

