
Figure 1. A Genome-wide CRISPR Death Screen to Identify Genes Necessary for OXPHOS.
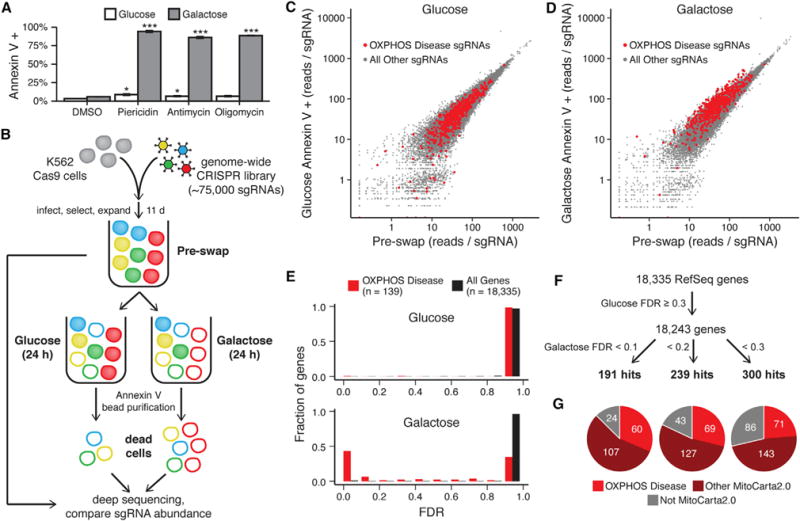
(A) Cell death was measured by Annexin V staining and flow cytometry in K562 cells cultured in glucose- or galactose-containing medium with the RC inhibitors piericidin (10 nM), antimycin (100 nM), or oligomycin (10 nM) or DMSO vehicle control. Data are expressed as mean ± SEM (n = 3). *p < 0.05, ***p < 0.001, t test relative to DMSO treatment in the corresponding medium.
(B) Schematic overview of the genome-wide CRISPR screen. K562 cells expressing Cas9 were infected with a lentiviral CRISPR sgRNA library, split into glucose-containing or galactose-containing medium, and cultured for 24 hr. Dead cells under each condition were purified using Annexin V, and the abundance of each sgRNA was compared with a reference sample of all cells from before the medium exchange (pre-swap). Red represents cells expressing an sgRNA for an OXPHOS disease gene.
(C and D) The median-normalized read count of each sgRNA averaged across two infection replicates is compared between the pre-swap cells (x axis) and the Annexin V+ dead cells after growth in glucose (C) or galactose (D) (y axis).
(E) Gene enrichment in Annexin V+ cells from glucose (top) and galactose medium (bottom) was scored using MAGeCK, and the fraction of known OXPHOS disease genes and all genes with a given FDR is shown.
(F) Schematic representing the approach used to identify hits in the screen and the number of hits below each galactose FDR threshold.
(G) The distribution of hits for each galactose FDR threshold between known OXPHOS disease genes (red), other mitochondrial genes as defined by MitoCarta2.0 (maroon), and non-mitochondrial genes (gray). See also Figure S1 and S2.