
Figure 3. Mitochondrial Pathways Underlying the Glucose/Galactose Death Phenotype.
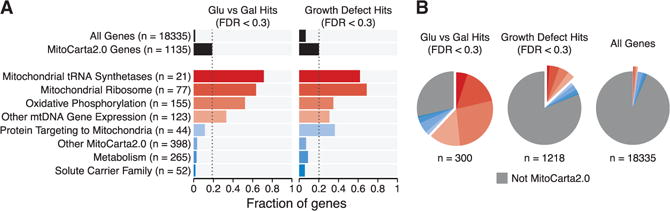
(A) The MitoCarta2.0 genes targeted by the CRISPR library were partitioned into eight distinct functional categories, and the fraction of genes in each category that were hits below 30% FDR is shown for the glucose/galactose death phenotype (left) or growth defect phenotype (right). The fractions of all genes and all MitoCarta2.0 genes that were hits are shown at top (black bars). Dashed lines indicate the fraction of MitoCarta2.0 hits.
(B) The distribution of hits below 30% FDR into the same eight MitoCarta2.0 categories and the non-MitoCarta2.0 category is shown. The distribution of all genes in the CRISPR library into those categories is shown for comparison.