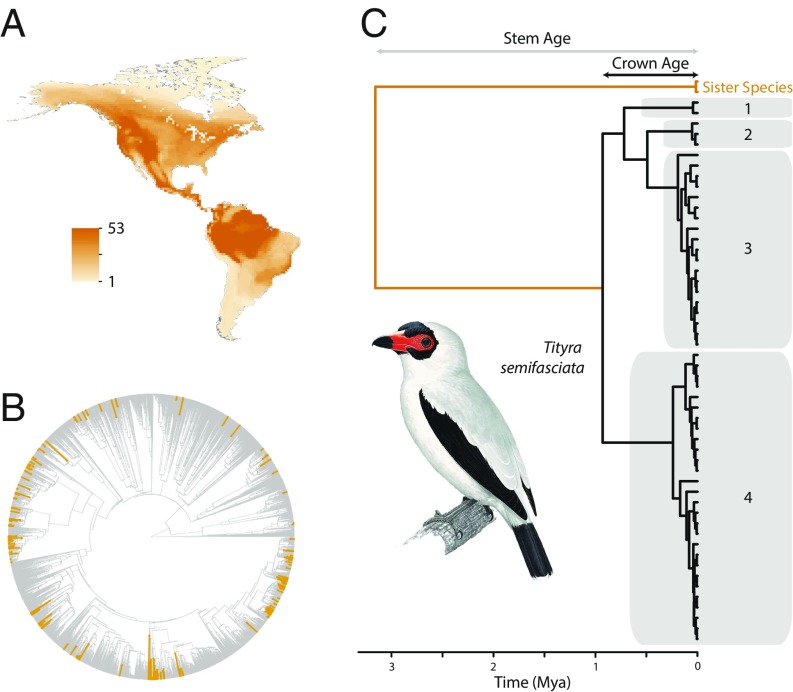
Fig. 1.
Sampling strategy and approach to measuring population differentiation. (A) Overlaid distribution maps from the New World bird species used to estimate population genetic differentiation (n = 173). (B) The phylogenetic distribution of the study species within the tree of life of all birds (24). The orange branches indicate the species examined in this study. They are distributed throughout the tree and represent replicates with varying levels of phylogenetic independence for the purpose of comparative analysis. (C) An example of a mitochondrial gene tree used to estimate the rate of population genetic differentiation within one of the 173 study species, the Masked Tityra (Tityra semifasciata). The gray polygons represent population clusters for this species as inferred using bGMYC (19) based on a posterior probability threshold of shared population membership of 0.8. The stem age and crown age for this species, used to estimate rates of differentiation, are also depicted. The image was provided by Del Hoyo et al. (58).

