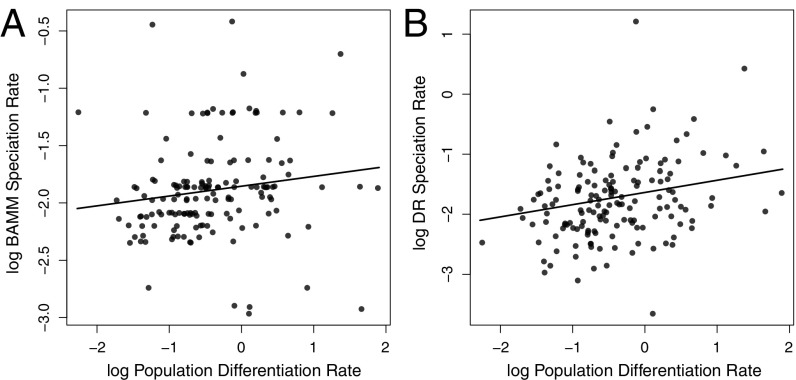
Fig. 3.
Plots showing the association between population differentiation and speciation rates across all 173 study species. Plots are presented based on speciation rates from (A) BAMM analysis [STRAPP correlation coefficient: (r) = 0.264, P = 0.018] and (B) the DR statistic (PGLS slope = 0.203, P < 0.001). The trend line for the plot using BAMM speciation rates is based on ordinary least-squares regression.

