Fig. 1.
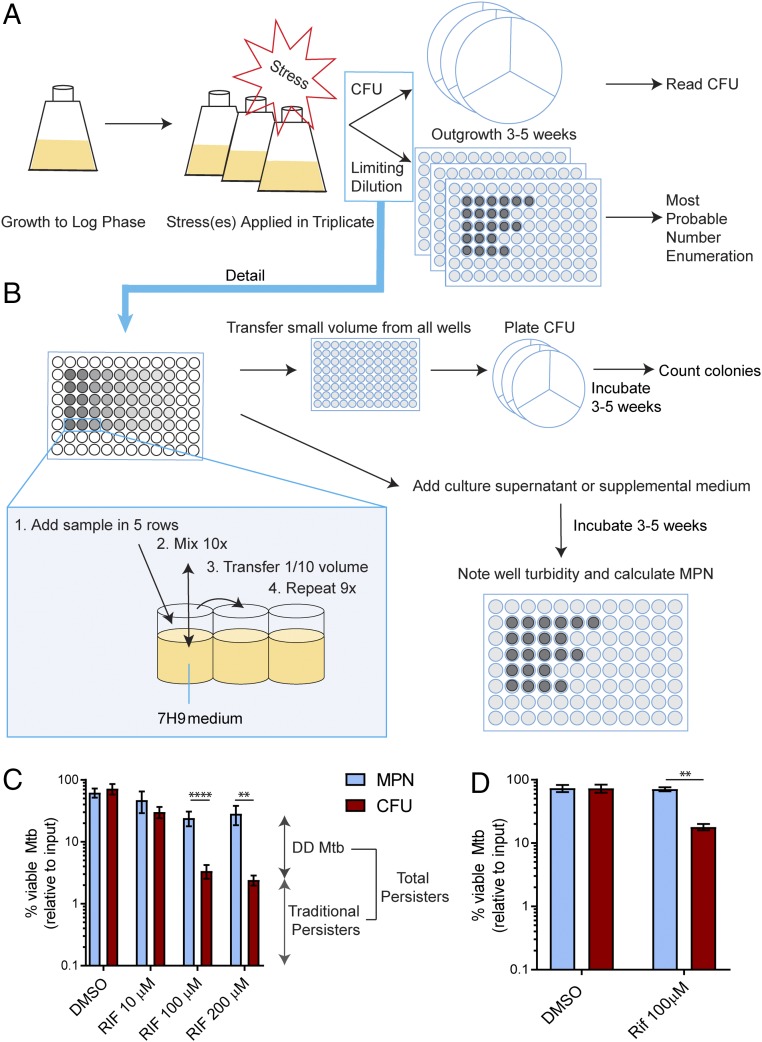
Schema for producing and counting DD Mtb. (A) General schema. Mtb is grown to log phase, subjected to stresses, and diluted serially in a rich medium in pentuplicate to the point that no growth is observed at the higher dilutions. Samples from the same dilution series are spread on agar plates made from nutrient-rich medium to count cfus. When there is no further outgrowth in the dilution series, the pattern of growth of Mtb in the dilution series is recorded and is used to determine the MPN. DD Mtb = MPN – cfus. (B) Detailed schema. After vortexing, samples are added to five replicate rows of a 96-well plate filled with 7H9 complete medium. Each well is mixed 10 times before transferring 1/10 of the volume to the next column, using filtered pipet tips and changing tips at each step. This procedure is repeated for a total of nine dilutions. The cfus are determined directly from aliquots of the dilution plates, not from the original suspension. Turbidity of dilution wells is recorded beginning at 3 wk and again as necessary until 2 wk have passed with no turbidity appearing at a higher dilution than at the previous reading. (C) DD Mtb formation. Exposure of H37Rv Mtb to RIF (10 μM, 100 μM, or 200 μM) for 5 d after 2 wk of starvation induces ∼90% DD Mtb. Data are means ± SEM for 21 biological replicates from seven experiments for DMSO and 100 μM RIF and for at least six biological replicates from two experiments for other points. (D) Independent confirmation. Using Method for Generation of DD Mtb Subpopulation as its guide, a second laboratory performed experiments like those in C. Data are means ± SEM for four replicates from two experiments. **P < 0.01; ****P < 0.0001.

