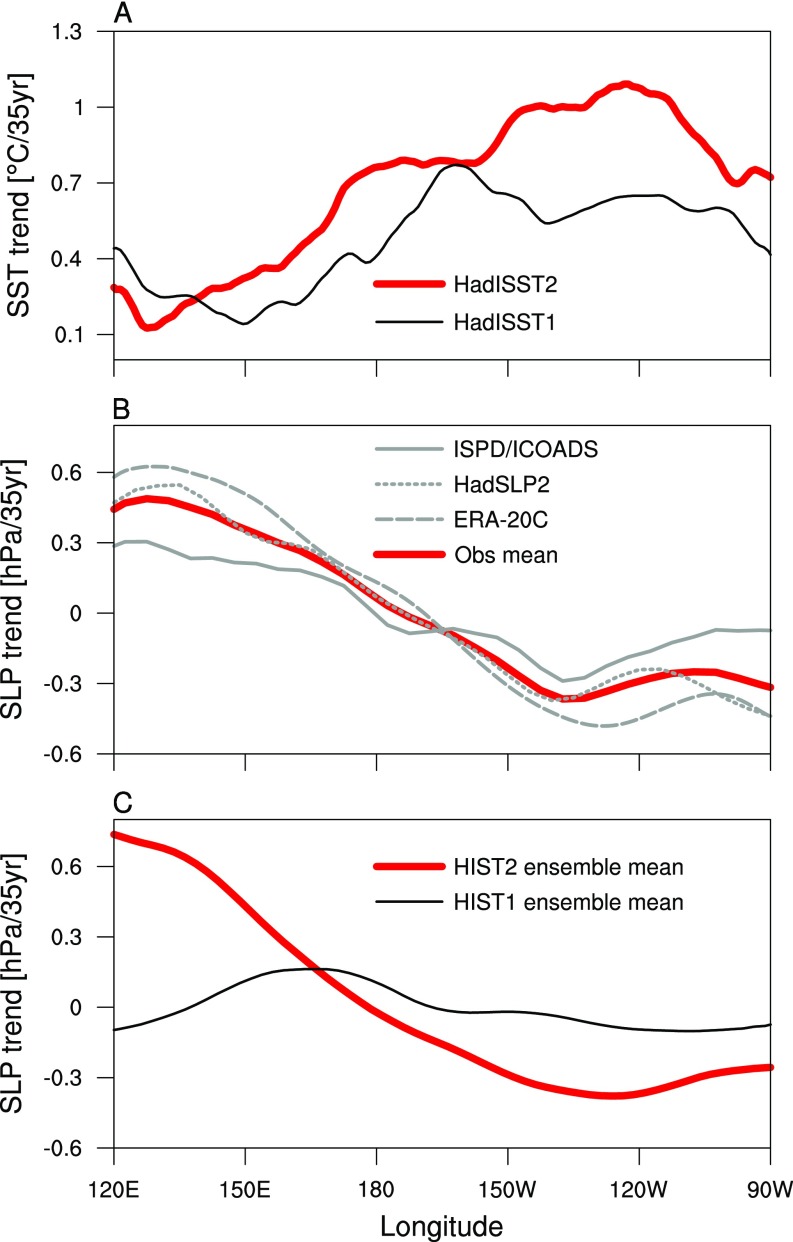
Fig. S3.
Comparison of November–March mean SST and sea level pressure (SLP) trends averaged over the tropical Pacific (10°S–10°N) for 1908–1942. (A) SST trends from HadISST2 (red) and HadISST1 (black), (B) observed SLP trends from the International Surface Pressure Databank/International Comprehensive Ocean–Atmosphere Data Set (ISPD/ICOADS; gray solid), the UK Met Office Hadley Centre mean SLP (HadSLP2; gray short dashed), the European Centre for Medium-Range Weather Forecast 20th-Century Reanalysis (ERA-20C; gray long dashed) and their mean (red), and (C) simulated SLP trends from the HIST2 (red) and HIST1 (black) experiments.

