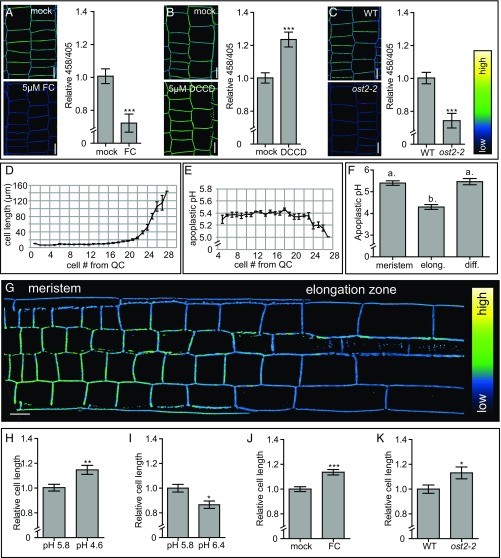
Fig. 1.
Apoplastic pH and epidermal cell length correlation in A. thaliana roots. (A and B) The effect of 5 μM fusicoccin (FC) treatment for 60 min and 5 μM DCCD treatment for 17 h on the apoplastic pH in A. thaliana roots, visualized using HPTS staining. y-axis: mean 458/405 values of epidermal cells in root meristems of the pharmacologically treated seedlings relative to mock-treated seedlings. (C) Comparison of the apoplastic pH in WT and ost2-2 mutant seedlings, visualized by HPTS staining. y-axis: the mean 458/405 values of the ost2-2 mutant roots relative to the WT. (A–C) Error bars represent SEM (n ≥ 13 roots per line/condition). Student t test P values: *P < 0.05, **P < 0.01, ***P < 0.001. (D, E, and G) Epidermal cell length with the corresponding absolute apoplastic pH, as visualized using HPTS staining. Error bars represent SEM (n = 11 roots). (F) Apoplastic pH of the epidermal apoplast in the root meristem, elongation, and differentiation zones (Fig. S1C). Error bars represent SEM. Statistical significance (0.05%) was tested using a one-way ANOVA test with a Tukey-Kramer post hoc test (n ≥ 14 roots). (H and I) Epidermal cell length in the distal meristem of seedlings grown on pH 5.8 growth medium and transferred for 2.5 h on pH 4.6 or 6.4 growth medium. (J) The effect of 19 h of 10 μM FC treatment on the root epidermal cell length. (K) Root epidermal cell length of WT and ost2-2 seedlings. (H–K) Error bars represent SEM. (n ≥ 13 roots). Student t test P values: *P < 0.05, **P < 0.01, ***P < 0.001. (A–C and G) Color code (black to white) depicts (low to high) 458/405 intensity, and thus, pH values. (Scale bars: 10 μm.)

