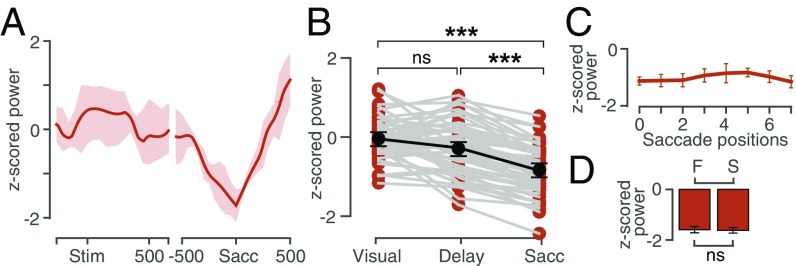
Fig. 8.
Beta band properties. (A) Average z-scored beta power aligned to stimulus onset (Left) and saccade onset (Right) showing a decrease in beta power below the baseline level, during the saccade epoch. Shading: standard deviation (B) The average peak z-scored beta power for the population of recorded LFP sites in the visual epoch, delay epoch, and the saccade epoch. (C) The average z-scored beta power in all eight positions for the population of recorded LFP sites in the saccade epoch showing no significant tuning. (D) Population average beta activity for fast (F) and slow (S) RTs.

