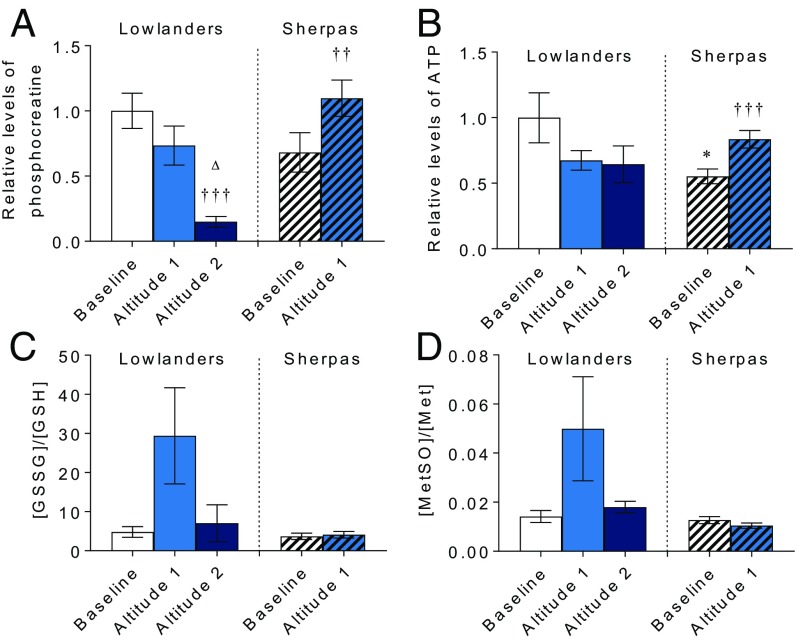
Fig. 6.
Muscle energetics and oxidative stress. PCr (A), ATP (B), oxidized/reduced glutathione (GSSG/GSH) (C), and sulfoxide/total methionine (MetSO/Met) (D), all expressed relative to Lowlanders at baseline, are shown. Mean ± SEM (n = 8–14). ††P ≤ 0.01, †††P ≤ 0.001 at baseline vs. altitude within cohort. △P ≤ 0.05 at altitude 1 vs. altitude 2 within cohort.

