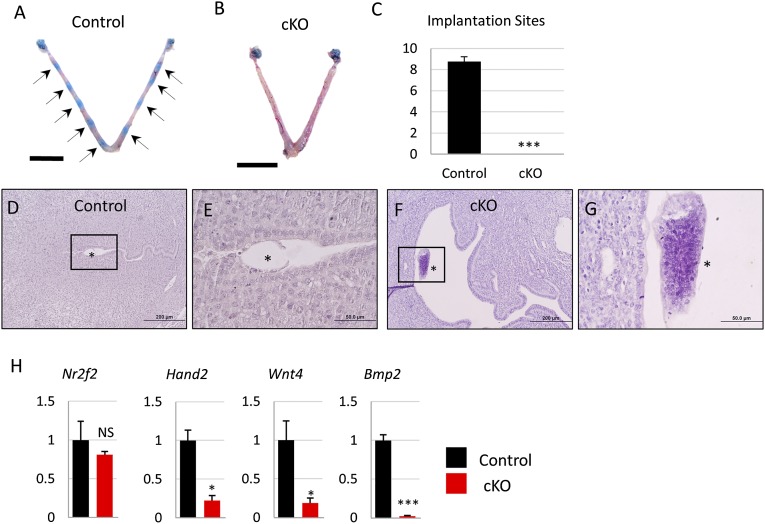
Fig. 2.
Embryo implantation at 4.5 dpc is absent in Fst-cKO mice. (A and B) Implantation sites were visualized at 4.5 dpc by intraocular injection of females with Chicago Blue dye. Black arrows indicate implantation sites. (C) The number of implantation sites visible as blue bands by Chicago Blue dye in control (n = 4) and Fst-cKO females (n = 11) was counted and is reported as mean ± SEM. (D and E) H&E staining of implantation sites and uterus from control and Fst-cKO mice. (F and G) Higher magnification of boxed areas of D and E. Asterisks indicate embryos. (H) Gene-expression data comparing relative mRNA levels in implantation sites or uterus at 4.5 dpc (control, n = 3; cKO, n = 3). Gene-expression data are normalized to levels of 36B4 mRNA with the average value of the control set to one and are compared across genotype. Data are presented as mean ± SEM; *P < 0.05, ***P < 0.005. (Scale bars: A and B, 1 cm; D and F, 200 μm; E and G, 50 μm.) NS, not significant.

