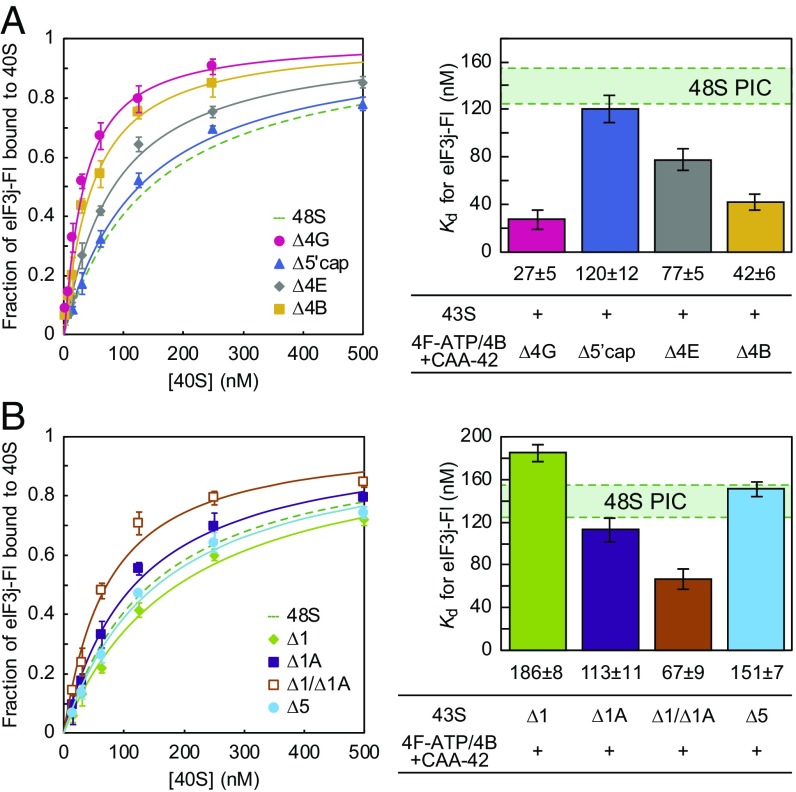
Fig. 4.
Contribution of initiation complex components on mRNA recruitment. eIF3j-Fl vs. 48S PIC saturation curves (Left) and the calculated equilibrium dissociation constants (Right) as described in Fig. 1B using CAA(AUG)-42 mRNA. Shown is eIF3j-Fl affinity in the presence or absence of 4GΔN, m7G cap, eIF4E, and eIF4B (A) or of eIF1, eIF1A, and eIF5 (B). Note that the concentrations of eIF4A, eIF4E, and eIF4B were increased twofold in the absence of eIF4G, to compensate for a possible decrease in affinity of these components. Green dashed lines and green shaded areas represent the control data obtained with the complete set of 48S PIC components and CAA(AUG)-42 mRNA (Fig. 1C). Data represent mean ± SD of three independent experiments.

