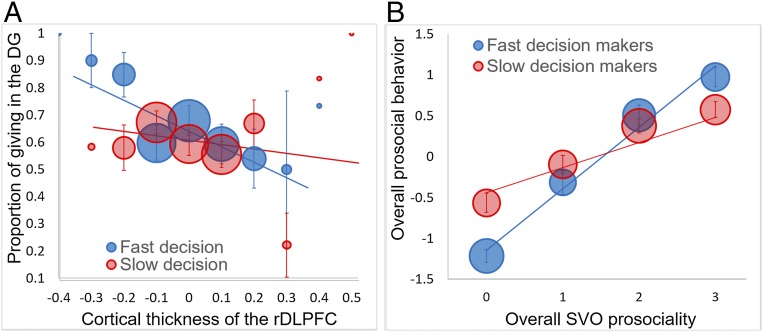
Fig. 1.
Relationship between prosocial behavior and the correlates for the fast and the slow decision makers. (A) Cortical thickness of the right DLPFC (rDLPFC) and the proportion of giving in the DG. (B) SVO measure of prosociality and overall prosocial behavior. The circle size represents the sample size for each 0.1-mm interval of cortical thickness (A) or for each level of SVO prosociality (B). Error bars indicate SEs for the circles, of which n > 3. Regression lines are based on individual scores.

