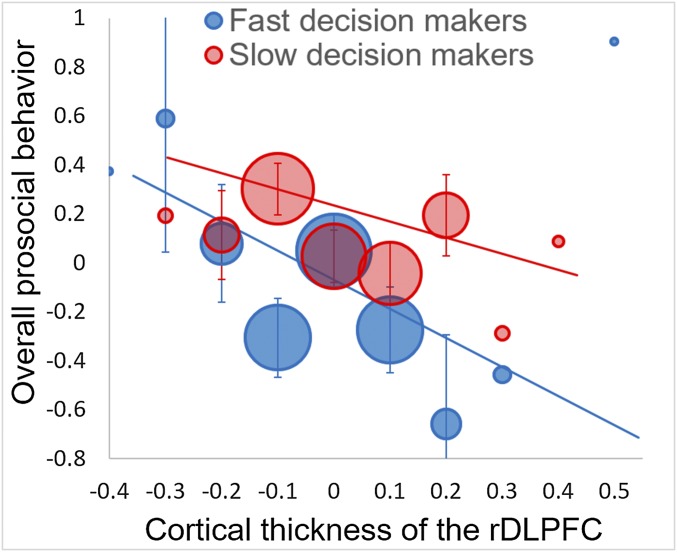
Fig. S1.
Relationship between the overall prosocial behavior and the cortical thickness of the right DLPFC (rDLPFC). The circle size represents the sample size for each 0.1-mm interval of cortical thickness. Error bars indicate SEs for the circles, of which n > 3. Regression lines are based on individual scores.

