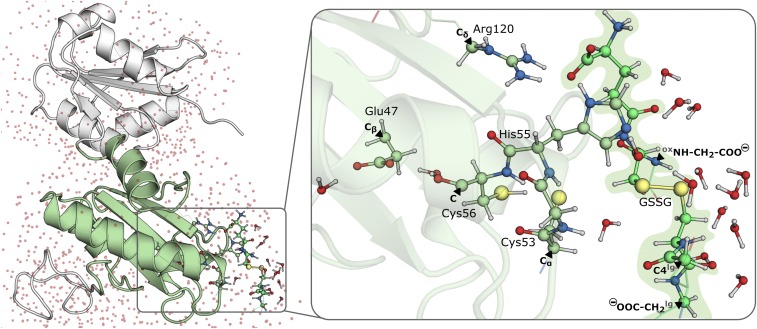
Fig. 3.
Optimized enzyme–substrate complex. (Left) The full ONIOM model with the a domain in green cartoon, b domain in white cartoon, and water molecules as red dots. (Right) The DFT layer with black triangles pointing to the atoms, labeled in bold, where the DFT layer was capped with H atoms following the link atom approach (the ox and lg in superscript distinguish the two GSH molecules in GSSG).

