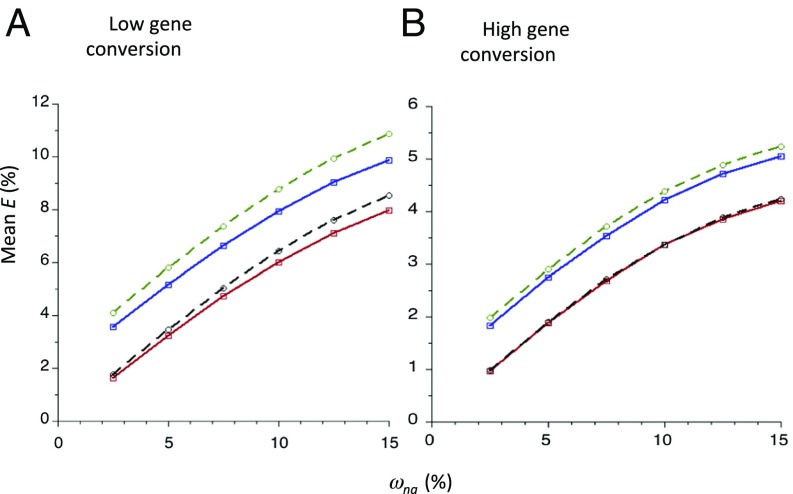
Fig. 2.
This plots the theoretical values of mean E (percent) against values of mean ωna (percent) for the standard model of a single gene with five exons of 100 codons each; a gamma distribution of selection coefficients with β = 0.3 was assumed, with γc = 5. For the results obtained by the summation method (red and blue solid lines), the exons were separated by four introns of 100 bp. For the results obtained from the integral model (black and green dashed lines), a continuous stretch of coding sequence was assumed. The green and blue lines show the net BGS effects arising from both NS and UTR sites; the black and red lines show the effects for NS sites alone. Two-thirds of coding sites were assumed to result in NS mutations. The rate of crossing over per base pair was 1 × 10⁻⁸, and the mutation rate was 4.5 × 10⁻⁹ per base pair. The gene conversion parameters for the low gene conversion case (A) were gc = 1 × 10⁻⁸ and dg = 440; for the high gene conversion case (B), gc = 5 × 10⁻⁸ and dg = 500. No large effect mutations were allowed.

