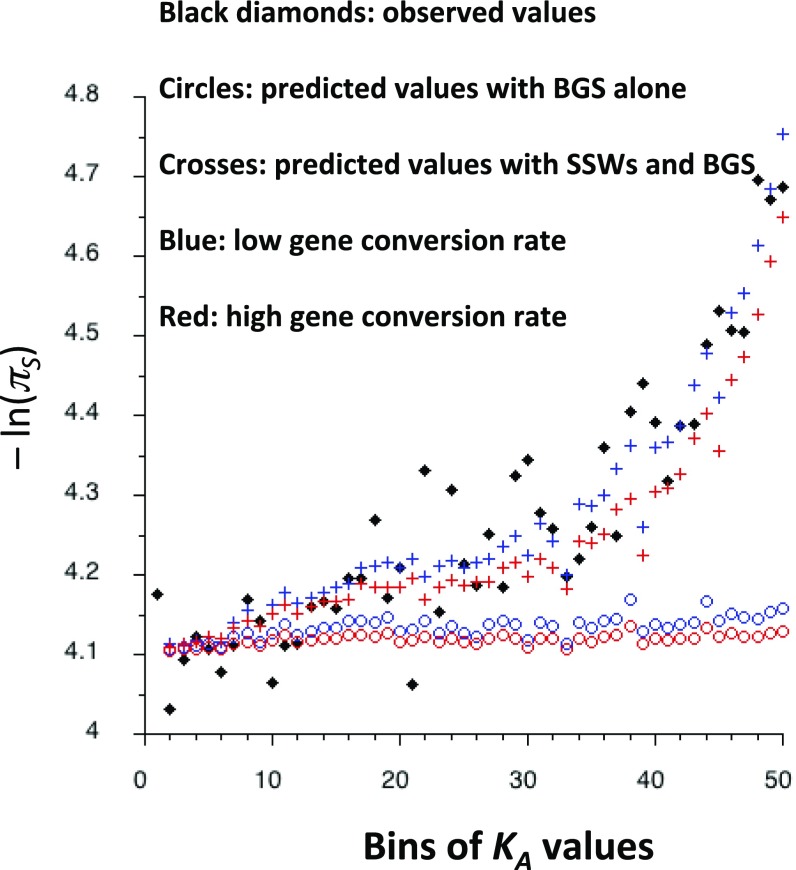
Fig. 3.
The black diamonds are the observed values of −ln(πS) for each bin of KA values for autosomes, corrected for the correlation between πS and KS as described in Materials and Methods, Primary Data Analyses. The circles are the theoretical values of mean E for each bin, obtained by the integral model of BGS, assuming a single gene with 500 NS sites. The crosses are the predicted values of −ln(πS) for each bin, given by the combined BGS and SSW models at NS and UTR sites. Red and blue correspond to the low and high gene conversion rates used in Fig. 2. The mutation rate and crossing-over parameters are as in Fig. 2, except that large effect mutations constitute 15% of all mutations, with a selection coefficient against heterozygotes of 0.044.

