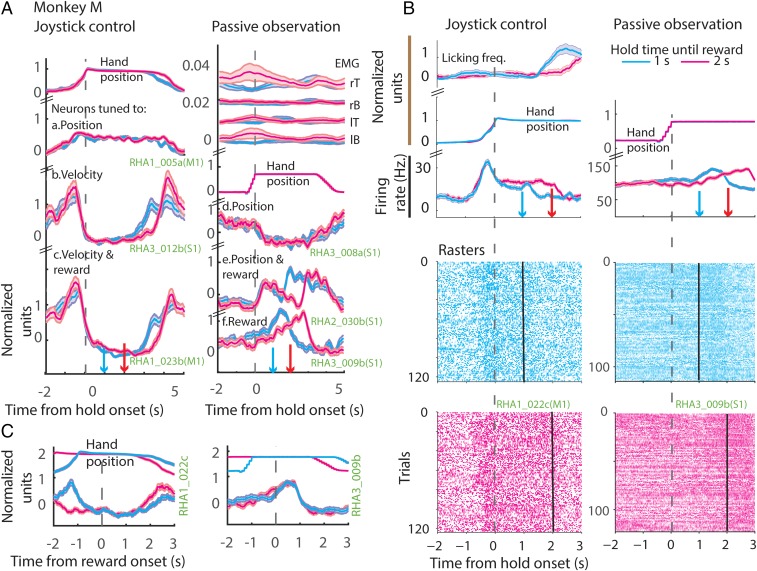
Fig. 2.
Neuronal modulation during task epochs. (A) Example neurons from a joystick control session (Left) and passive observation session (Right) from Exp. 1. (Left) The changes in the mean (z-scored) arm position (at the top), followed by binned (50 ms), z-scored firing rate (PETH) of example neurons, all aligned to onset of hold time. (Right) A passive observation session; the EMG activations are displayed at the top. EMGs were measured from left (lT) and right triceps (rT), and left (lB) and right biceps (rB). Then, the virtual arm position is plotted. Neurons tuned to position, velocity, reward, or a combination of those is displayed next. Bands around the mean represent ±1 SE. Data are color-coded based on the time of reward: early (blue) and late (red). Time of reward is indicated in the upper panels by color-coded downward-pointing arrows. Note that the arm is stationary during the hold period. Weak muscle activations were seen around the time of movements in the passive observation session. (B) Example neurons plotted in the same format as in A; however, the y axis depicts the absolute firing rate modulation. The lower panels show spike raster plots. (C) PETH of the example neurons shown in B aligned to the time of reward onset. y axis depicts the normalized firing rate modulation.

