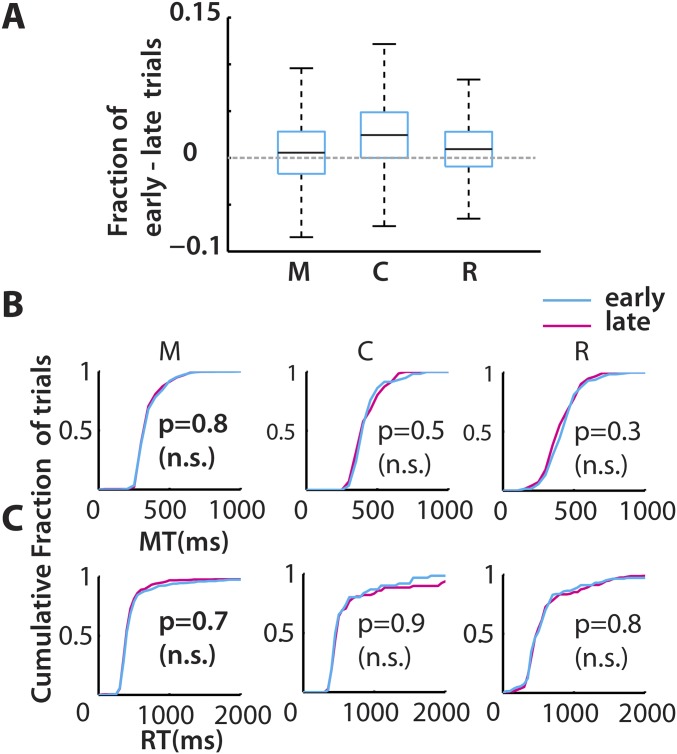
Fig. S1.
Effects of reward time on behavior. (A) All three monkeys (M, C, and R) attempted more early-reward trials than late-reward trials. Box plots represent pooled data from across sessions (monkey C, 14 sessions; M, 18 sessions; and R, 7 sessions). The row of panels show the MT in B and the RT in C, as a cumulative distribution, for all of the trials in a typical session color-coded by time of reward: early (cyan) and late (magenta). The RT and MT were not significantly different (n.s.) between early- and late-reward conditions (KS test: P > 0.05).

