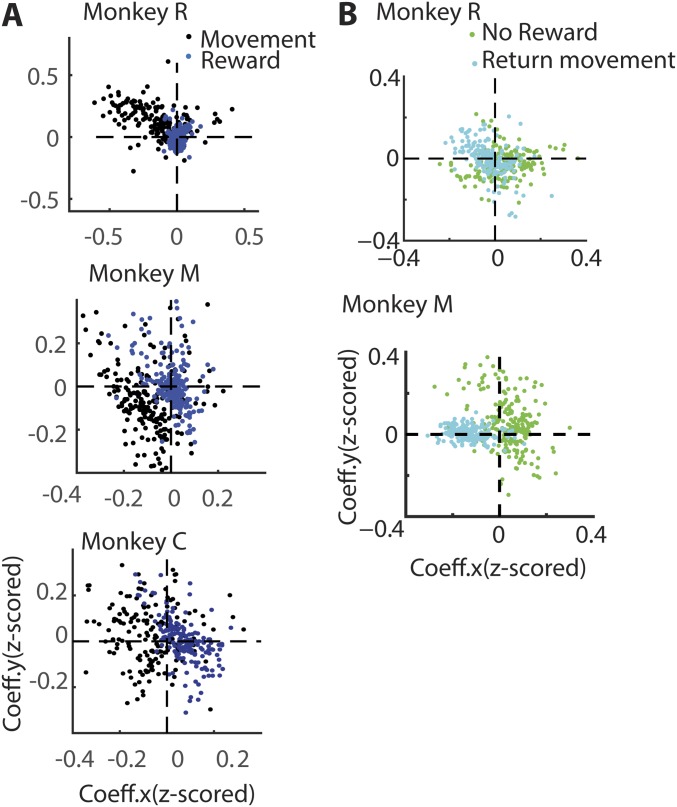
Fig. S5.
(A and B) Directional tuning of each neuron is captured by the scatter plots. The format is retained from Fig. 5C. (A) Comparison of directional tuning during the movement (black dots) with tuning during the last 400 ms of hold time epoch before reward delivery commenced (blue dots). (B) Comparison of directional tuning during the time of potential reward in no-reward trials (green dots) and tuning during the return movement epoch (cyan dots).

