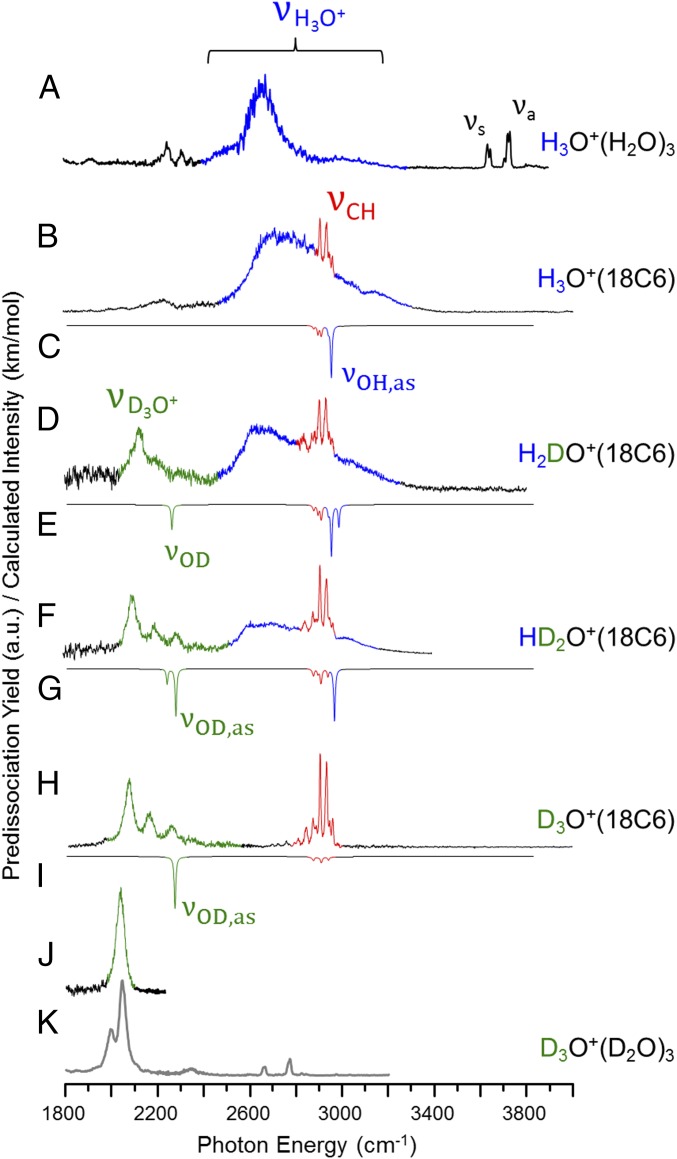
Fig. 4.
Evolution of the D2-tagged vibrational predissociation spectra of H3O+(18C6) upon sequential deuteration of the embedded H3O+ core are given in traces B, D, F, and H. Note that the OD stretching features (green) in the D3O+(18C6) spectrum (H) occur close to that of D3O+(D2O)3 (K). Additionally, the green trace in J shows the D3O+ peak without the splitting due to the tag effect. This was accomplished using a two-color, IR–IR double-resonance scheme (46) described in SI Appendix. Trace A displays the H3O+(H2O)3 spectrum for comparison (reproduced from ref. 9). Harmonic spectra [B3LYP/6–311++G(2d,2p) are scaled by 0.99556 below 2,700 cm−1 and by 0.95732 above 2,700 cm−1] and are included as inverted traces in C, E, G, and I.

