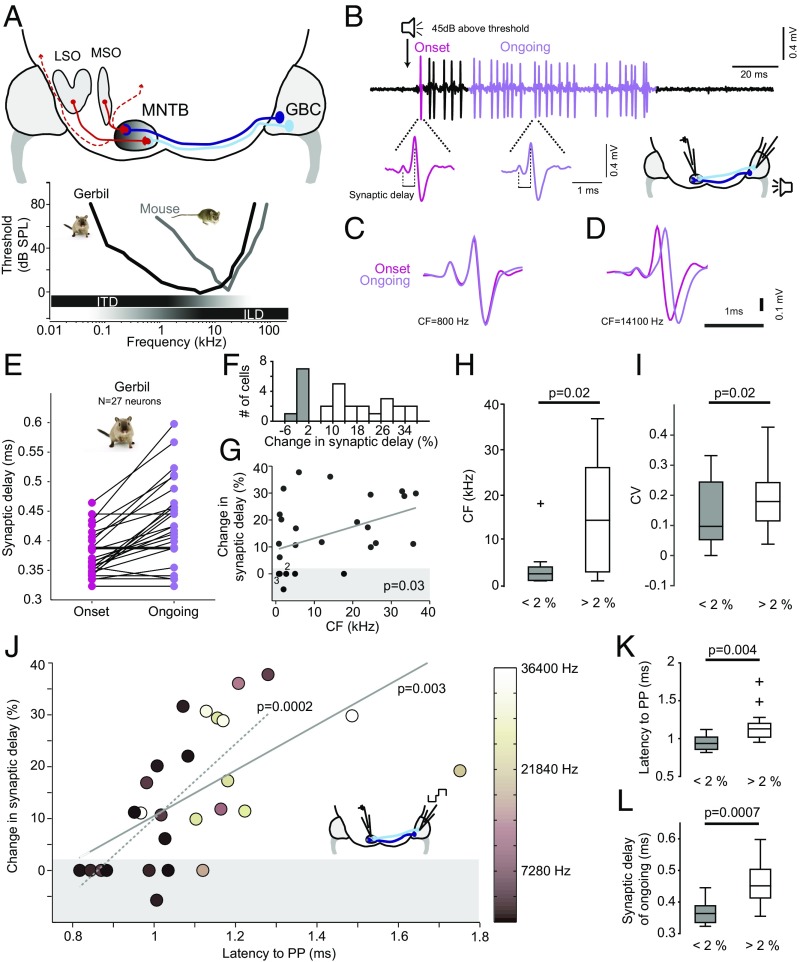
Fig. 1.
Constant synaptic delays only in low-frequency-tuned, fast-conducting axons of gerbils. (A) Schematic of the mammalian sound localization circuits. Globular bushy cell (GBC) axons project to the contralateral medial nucleus of the trapezoid body (MNTB) to form one-to-one connections via the giant calyx of Held synapses. MNTB neurons then project to many brainstem and midbrain nuclei (dashed red lines), most importantly the lateral and medial superior olive (LSO and MSO, respectively) for binaural computation of sound source location: for high-frequency sounds, interaural level differences (ILDs) are analyzed in the LSO, whereas for low-frequency sounds—due to a lack of ILDs—interaural time differences (ITDs) are detected in the MSO. Both in gerbil and mouse, the MNTB is tonotopically organized with medially terminating GBC axons (light blue) tuned to higher, and laterally terminating axons (dark blue) tuned to lower frequencies. However, due to differences in the absolute hearing range (Bottom), the gerbil, but not the mouse, uses ITDs for sound localization. Typical frequency ranges of ITD and ILD processing are depicted by horizontal bars below the audiograms. (B) Representative example of sound-evoked responses of a single gerbil calyx-to-MNTB synapse/neuron (Upper trace). Below are blowups showing waveforms of the prepotential and the postsynaptic action potential to stimulus onset (pink) and to ongoing stimulus periods (purple). (C) Overlay of the waveforms recorded from a MNTB neuron tuned to low sound frequencies (CF = 800 Hz, the range where ITDs are used for sound localization), revealing identical synaptic delays (SDs) for onset (pink) and ongoing responses (purple). (D) Same display as in C for a neuron tuned to high sound frequencies (CF = 14,100 Hz), exhibiting the expected increase in SD. (E) Mean SD for onset (pink) and ongoing (purple) response plotted for each neuron recorded in the gerbil (n = 27). (F) Distribution of change in SD over the population of neurons (n = 27). Bins with stable SD (<2%) are denoted in gray. (G) The changes in SD significantly correlate (P = 0.03, Pearson correlation) with the postsynaptic MNTB neurons’ CFs. Shaded area denotes stable SDs (changes <2%). (H) Neurons with stable SD (gray) show significantly lower CFs (P = 0.02, Mann–Whitney U test). Boxes indicate interquartile range with horizontal bar showing the median. Whiskers extend to the full data range, one outlier indicated by +. (I) Neurons with stable SD (gray) also had a significantly smaller coefficient of variation (CV) for ongoing SDs (P = 0.02, Mann–Whitney U test). Conventions are as in H. (J) Changes in SD strongly depend on the mean conduction latency of the presynaptic GBC axon (P = 0.003, Pearson correlation). The correlation did not depend on the two outliers with latencies >1.4 ms (dotted line, P = 0.0002, Pearson correlation). The CFs of the postsynaptic MNTB neurons are color coded. The conduction latency was measured by electric stimulation of GBC axons (see schematic). (K and L) In neurons with SD changes <2%, conduction latencies and absolute ongoing SDs are significantly shorter (P = 0.004 and P = 0.0007, respectively, Mann–Whitney U test) than for neurons with SD changes >2%. Conventions are as in H.

