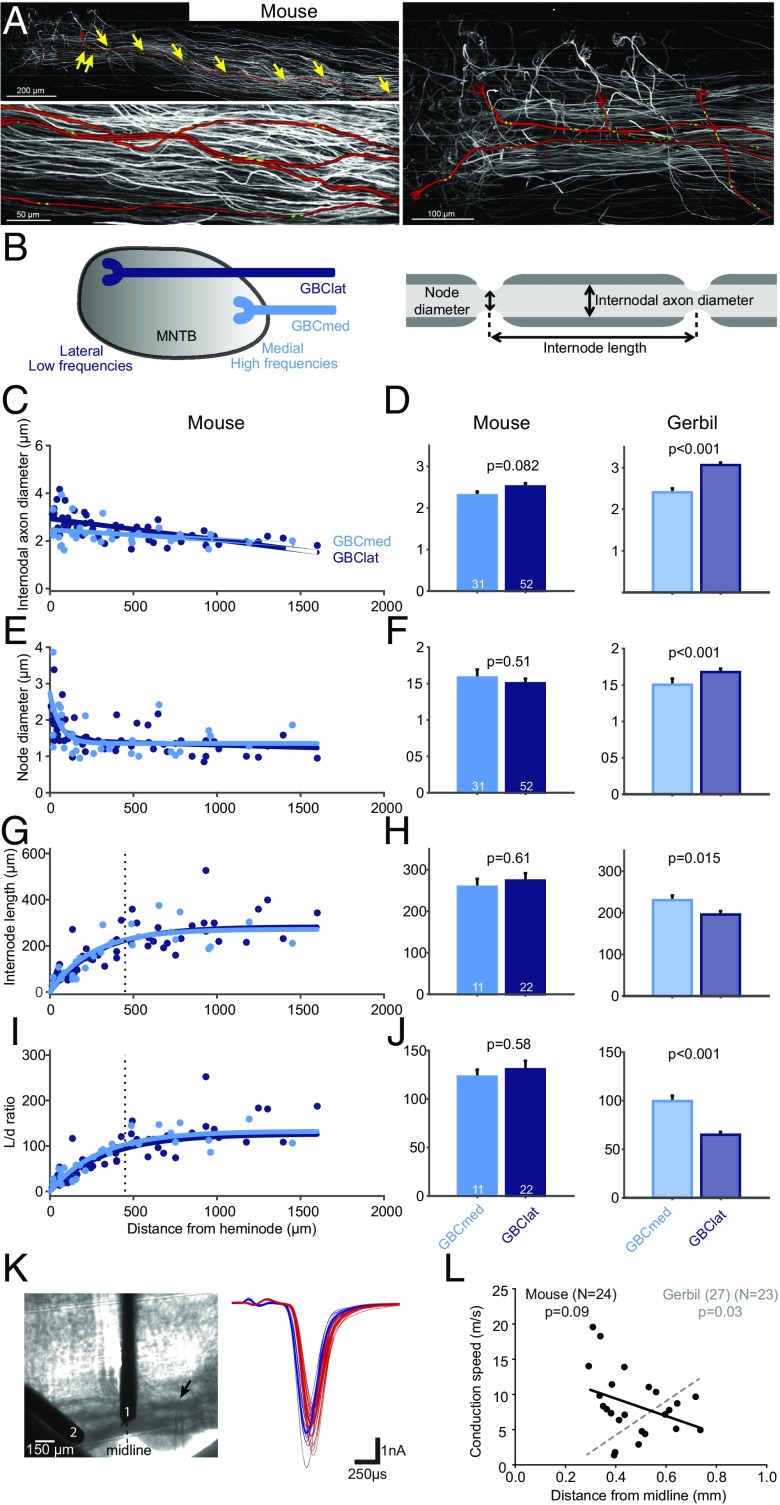
Fig. 3.
Absence of structural and physiological specialization in mouse GBC axons. (A) Projections of confocal image stacks of mouse GBC axons innervating the MNTB filled with tetramethylrhodamine dextran. (Top, Left) One axon is highlighted in red and individual nodes of Ranvier are marked with yellow arrows. (Bottom, Left) Magnification of four axons; the position of juxtaparanodal (potassium Kv1.2) immunolabeled channels is shown in green. (Right) The tonotopic identity of axons was determined based on the relative position of calyces of Held along the mediolateral axis of the MNTB. (B) Schematic of the tonotopically organized MNTB (Left) and a myelinated axon illustrating the analyzed parameters (Right). (C, E, G, and I) Internodal axon diameter (C), node diameter (E), internode length (G), and internode length/internodal axon diameter (L/d) ratio (I) plotted against the distance from the heminode for lateral (GBClat, dark blue, n = 8 fibers) and medial (GBCmed, light blue, n = 5 fibers) terminating fibers. (D, F, H, and J) Averages of internodal axon diameter (D), node diameter (F), internode length (H), and L/d ratio (J) in GBCmed and GBClat fibers of mouse (Left) and gerbil (Right) (replotted from ref. 28). Data are represented as mean ± SEM. P values are derived from two-sided t tests (number of data points is given in bars). Vertical dashed line in G and I denotes beginning of steady-state section of internode length. Only steady-state values were used for calculation of the average in H and J. In stark contrast to the gerbil, no differences in axon morphology and myelination patterning between medially and laterally ending GBC fibers are present in the mouse. (K) Conduction velocity of mouse GBC fibers was measured by electrical stimulation at two different positions along the trapezoid tract (1, 2: stimulation electrodes, arrow demarks recording electrode, Left), eliciting excitatory postsynaptic currents (EPSCs) in the MNTB in vitro (blue and red EPSCs were elicited by stimulation electrodes 1 and 2, respectively, Right). (L) The mean conduction speed of GBC axons (n = 24) plotted against the mediolateral position of their terminating region in the MNTB. There is no significant correlation for mouse (black regression line), contrasting earlier findings from the gerbil (replotted from ref. 28 in gray).

