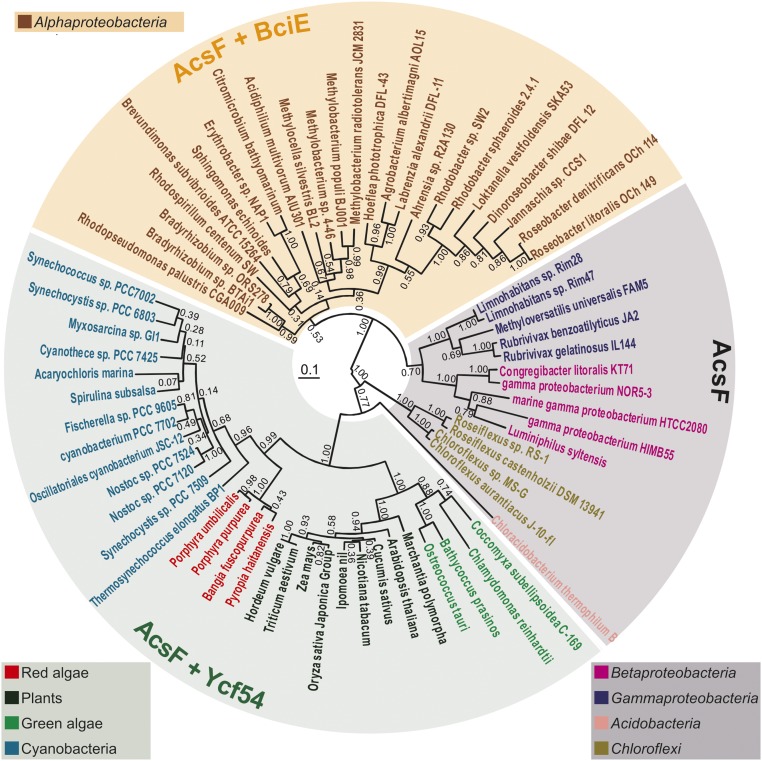
Fig. 5.
Phylogenetic analysis of AcsF proteins. Evolutionary analysis via a phylogenetic tree was conducted in MEGA6 using the maximum likelihood method based on the JTT matrix-based model. The analysis involved 69 protein sequences. The tree with the highest log-likelihood (−17,513.1099) is shown. Numbers next to each node indicate bootstrap values (1,000 replicates) as percentages. Phyla are distinguished by color of species name. The length of each branch represents the number of amino acid substitutions per site in proportion to the scale bar at the center of the tree. The presence/absence of BciE/Ycf54 is indicated by shading over the species names: gray, no BciE or Ycf54; orange, BciE present; green, Ycf54 present. Note that orthologs of both bciE and ycf54 are not found together in the genome of any organism sequenced to date.

