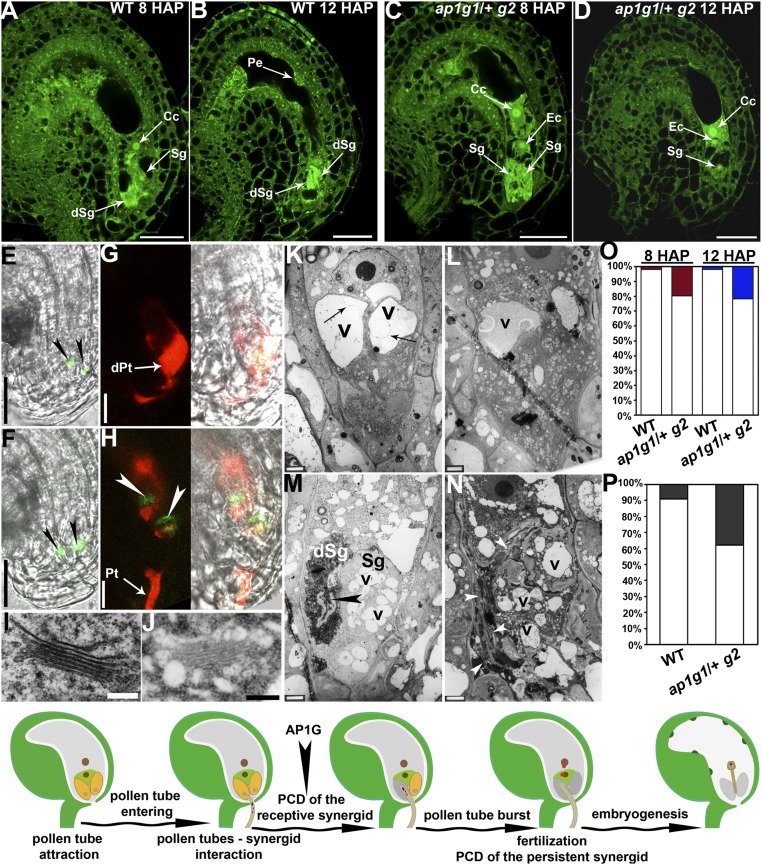
Fig. 3.
Synergid degeneration induced by pollen tube arrival is compromised by AP1G loss of function. (A–D) CLSM images of ovules from WT (A and B) or ap1g1/+ g2 (C and D) emasculated and hand-pollinated with wild-type pollen at 8 HAP (A and C) or 12 HAP (B and D). Image shown in C is projection of three confocal images taken at different focal planes to show the presence of different nuclei. (E–H) CLSM image of ovules from ProDD39:NLS-YFP (E and G) or ProDD39:NLS-YFP; ap1g1/+ g2 (F and H) before pollination (E and F) or pollinated with a ProLAT52:DsRed pollen tube at 8 HAP (G and H). The transgene ProDD39:NLS-YFP is present as homozygous single copy in both WT and ap1g1/+ g2. Arrowheads indicate synergid nuclei. Images in E and F are merges of GFP and bright-field (BF) channels. Images shown in G and H are merges of GFP/RFP channels and merges of GFP/RFP/BF channels. (I and J) TEM of a Golgi stack in a wild-type (I) or a presumble ap1g1 g2 synergid (J). (K–N) TEM of a wild-type (K and M) or a presumble ap1g1 g2 (L and N) embryo sac before pollination (K and L) or upon pollen tube entrance (M and N). Arrows in K indicate invaginated or convoluted vacuolar membrane inside the central vacuole of a synergid. Arrowhead in M indicates a discharging pollen tube. Arrowheads in N point at an overgrown pollen tube. (O) Quantitative analyses of synergid degeneration by CLSM. Percentage of ovules containing one synergid degenerated at 8 HAP or two synergids degenerated at 12 HAP is shown with open columns, whereas filled columns indicate the percentage of ovules containing two intact synergids at 8 HAP (red) or one intact synergid at 12 HAP (blue). (P) Percentage of discharging (empty columns) or nondischarging (filled columns) ProLAT52:DsRed pollen tubes at 12 HAP. In total, 25 pistils were analyzed for each genotype and all showed similar results. (Q) A cartoon model illustrating the steps leading to fertilization. Arrowhead indicates the timing of AP1G action in these processes. Cc, central cell; dSg, degenerated synergid; dPt, discharged pollen tube; Ec, egg cell; Pe, peripheral endosperm; Pt, pollen tube; Sg, synergid; v, vacuoles. (Scale bars: A–F, 25 µm; G and H, 10 µm; I and J, 200 nm; K–N, 2 µm.)

