Fig. 6.
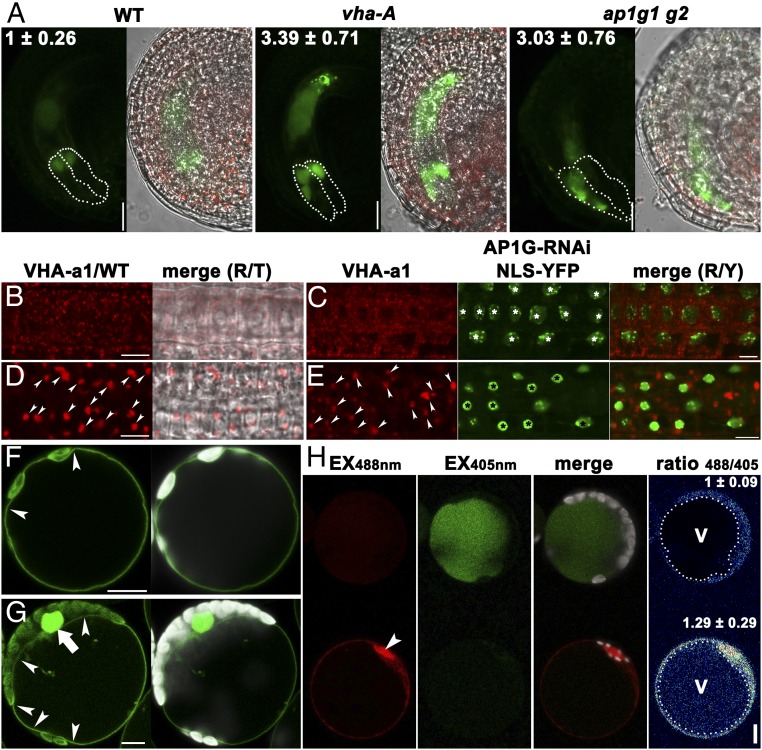
AP1G is critical for vacuolar acidification. (A) CLSM of unfertilized mature ovules from the ProUBQ10:Aleu-PR (WT), ProUBQ10:Aleu-PR;vha-A/+ (vha-A), or ProUBQ10:Aleu-PR;ap1g1/+ g2 (ap1g1 g2) transgenic plants. Numbers on the top are arbitrary intensity of Aleu-PR fluorescence in the vacuoles of synergids (highlighted with dotted lines). Results are means ± SD (n = 30). (B–E) CLSM of root epidermal cells from VHA-a1-RFP (B and D) or VHA-a1-RFP;ProUBQ10:AP1G-RNAi; ProUBQ10:NLS-YFP (C and E) transgenic plants with BFA treatment (D and E) or without (B and C). Arrowheads in D and E point at BFA compartments. Asterisks in C and E point at the nuclei labeled by NLS-YFP, indicative of AP1G-RNAi expression. (F and G) CLSM of an Arabidopsis leaf protoplast from the Pro35S:VHA-a3-GFP transgenic plants (F) or from the ProUBQ10:AP1G-RNAi;ProUBQ10:NLS-YFP transgenic plants (G). Arrowheads point at the tonoplast. The arrow indicates the nucleus labeled by NLS-YFP, indicative of AP1G-RNAi expression. (H) Mesophyll protoplasts from the ProUBQ10:Aleu-PR transgenic plants. Emission intensities were shown in red (excitation at 488 nm, Ex488nm) or green (excitation at 405 nm, Ex405nm). The bottom one was transformed with ProUBQ10:AP1G-RNAi;ProUBQ10:NLS-YFP as indicated by the NLS-YFP–labeled nucleus (false-colored red, pointed at by an arrowhead). Pseudocolor image in the Right panel indicates the 488/405 nm ratio of fluorescence intensity within the vacuoles (highlighted with dotted circles). On the top right are means ± SD (n = 30). v, vacuole. The expression of AP1G-RNAi resulted in a significant difference in vacuolar pH (t test, P < 0.01). (Scale bars: 10 µm.)

