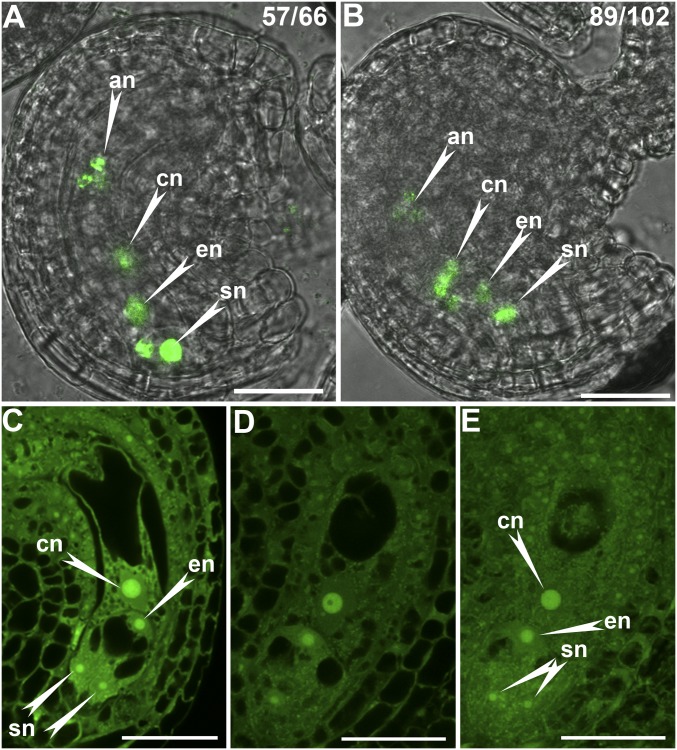
Fig. S2.
Functional loss of AP1G did not compromise the patterning of female gametophytes. (A and B) CLSM of a representative immature ovule from ProES1:NLS-YFP (A) or from ProES1:NLS-YFP;ap1g1/+ g2 plants (B). On top is the ratio of displayed ovules among all ovules examined. Left images are merges of fluorescent and bright-field images. (C and D) A single optical section of mature ovules from WT (C) or ap1g1/+ g2 plants (D). (E) Maximum projection of Z-stack images captured for the ovule shown in D. An, antipodal nuclei; cn, central cell nuclei; en, egg cell nuclei; sn, synergid nuclei. (Scale bars: 25 µm.)

