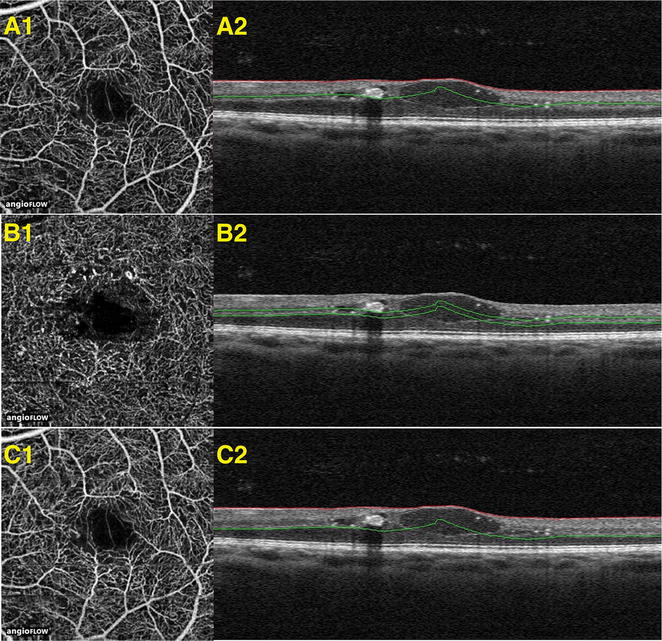
Fig. 1.

Segmentation of superficial, deep, and summated retinal vascular plexus. OCT-B scans with segmentation shown in correspondence with OCTA images delineating the area of the vasculature being examined. These images are from a patient diagnosed with diabetic macular edema. A1, A2 demonstrate OCTA image with its corresponding OCT B-scan, respectively, at the superficial plexus. B1, B2 demonstrate OCTA image with its corresponding OCT B-scan, respectively, at the deep plexus. C1, C2 demonstrate OCTA image with its corresponding OCT B-scan, respectively, at the summated plexus
