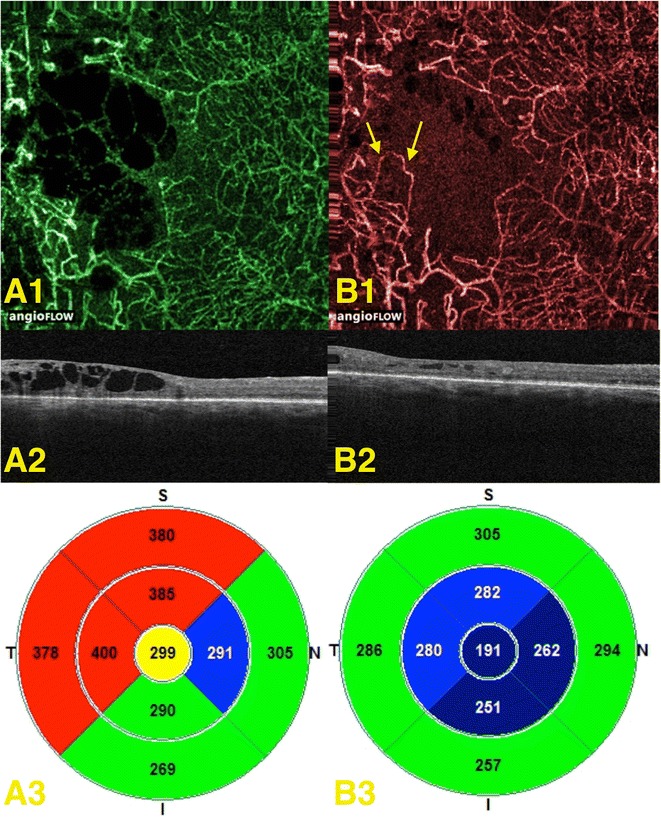
Fig. 6.

Disappearance and reappearance of flow signal in the deep plexus. A1 expresses the OCT angiogram of the initial patient visit; A2, A3 represent the corresponding OCT-B scan and retinal thickness map, respectively. B1 expresses the OCT-angiogram of the second patient visit, with arrows pointing to vessels that were not found in the in the initial visit due to loss of flow signal. B2, B3 represent the corresponding OCT-B scan and retinal thickness map, respectively
