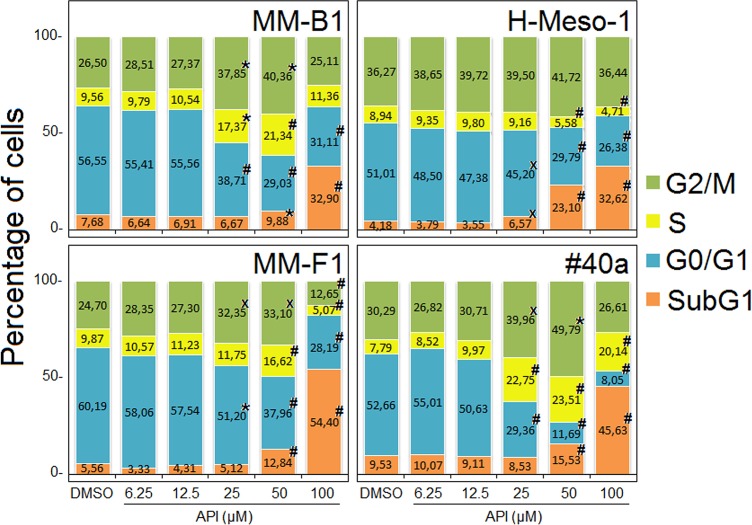
FIGURE 7.
Stacked bar graphs showing the percentage of cells in different phases of the cell cycle. Percentage of cells in subG1, G0/G1, S, and G2/M phases was calculated with CellQuest Pro 5.2 software. Results represent mean values from three independent experiments. Statistical significance of the effects obtained with API treatment was calculated vs. those obtained in DMSO-treated cells with one-way ANOVA analysis of variance (xp ≤ 0.05, ∗p ≤ 0.01, #p ≤ 0.001).

