
Figure 3. Transcriptional and chromatin landscape re-programming during macrophage conversion.
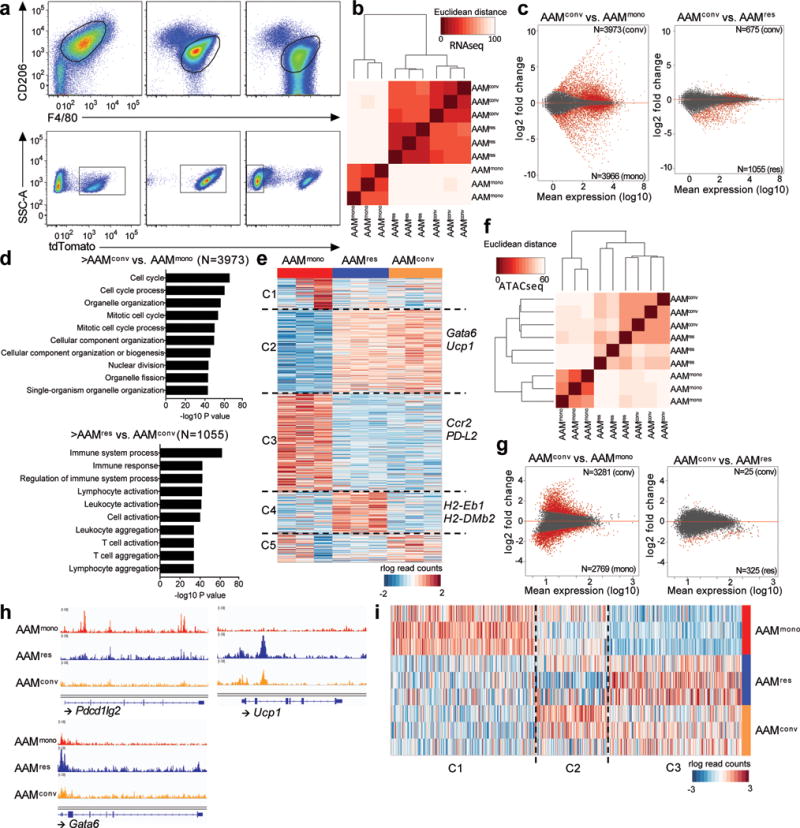
(a) Representative flow plots showing gating strategies for three different populations of macrophages (AAMmono: n=3, AAMres: n=3, AAMconv, n=3). (b) Pairwise Euclidean distance with respect to the transcriptional profiles from each sample showing AAMconv transcriptionally resembles AAMres. (c) MA plots of differential analyses comparing the transcriptional profiles of AAMconv to that of AAMmono and AAMres, respectively. Differential genes (FDR 10%, |LFC| > 0) are highlighted in red. (d) GO analysis of genes upregulated in AAMconv when compared to AAMmono (top), as well as genes downregulated in AAMconv when compared to AAMres (bottom). (e) Clustering of rlog-transformed read counts of expressed genes in AAMmono, AAMres and AAMconv showing 5 different clusters of genes (C1–C5). (f) Pairwise Euclidean distance with respect to the accessible REs from each sample showing the open chromatin landscape in AAMconv resembles that of AAMres. (g) MA plots of differential analyses comparing the accessible Res in AAMconv to that of AAMmono and AAMres, respectively. Differential regions (FDR 10%, |LFC| > 0) are highlighted in red. (h) Genome browser views of the Pdcd1lg2 (PDL2), Ucp1 and Gata6 gene bodies in AAMmono (red track), AAMconv (blue track) and AAMres (orange track). Each track represents normalized read counts of accessible chromatin regions. (i) Clustering of rlog-transformed read counts of accessible REs in AAMmono, AAMres and AAMconv showing 3 different clusters of REs (C1–C3).