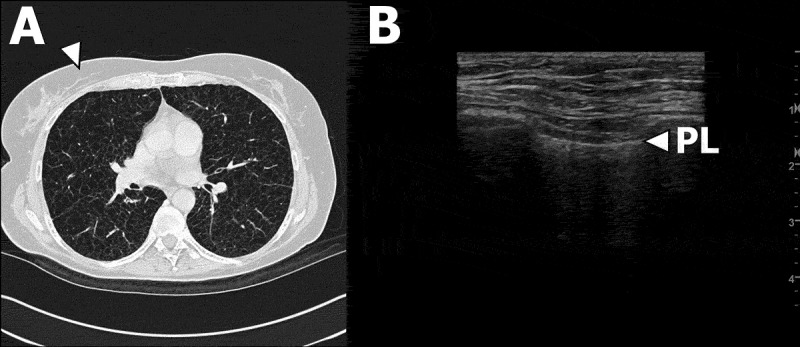
Figure 3.

Patient #8 with LAM. (A) Transverse high-resolution computed tomography (HRCT) image of right upper and middle central and peripheral lobe areas and left upper central and peripheral lobe areas according to Belmaati.[26] White arrow corresponds anatomically to right LUS zone 2 in B. (B) LUS clip of right LUS zone 2. White arrow indicates the pleural line.
