Figure 3.

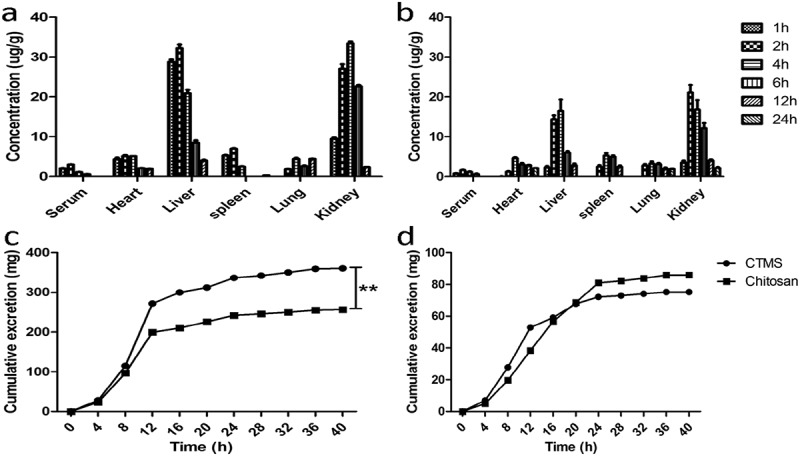
Distribution and expression of CTMS and chitaosan in SD rats after treatment. The 24 hr distribution of CTMS (a) and chitosan (b), as well as the urinary (c) and faecal (d) expression of CTMS and chitosan.

Distribution and expression of CTMS and chitaosan in SD rats after treatment. The 24 hr distribution of CTMS (a) and chitosan (b), as well as the urinary (c) and faecal (d) expression of CTMS and chitosan.