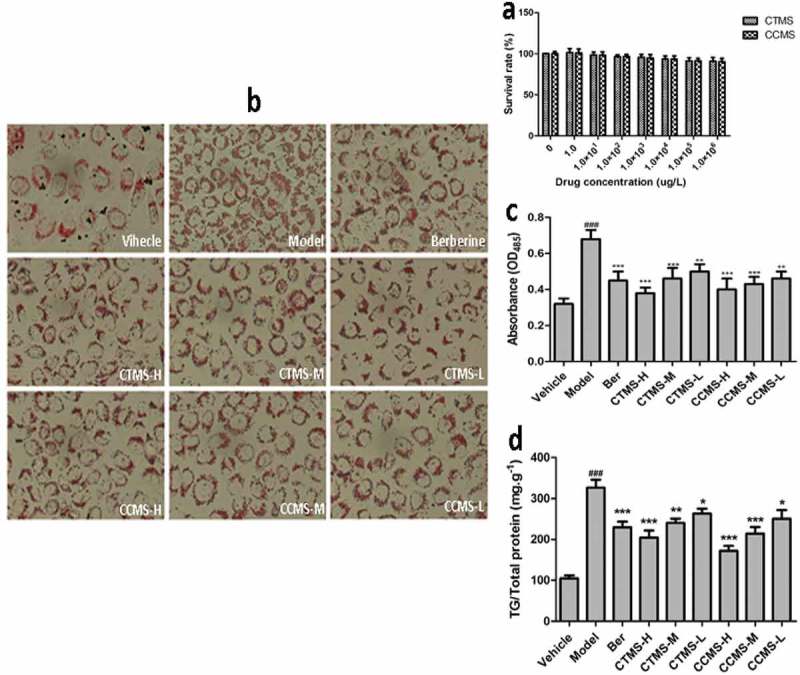
Figure 6.

In vitro inhibiting effects of CTMS and CCMS on oleic acid-induced lipid accumulation in HepG2 cells. (a) The MTT assay results (x ± s, n = 6); (b) Oil red O staining maps of HepG2 cells; (c) Lipid accumulation inhibiting results; (d): Inhibiting effects on the TG content.
Note: Vehicle: stained with only high glucose DMEMcontaining 10% FBS; Model: stained with high glucoseDMEM containing 10% FBS and 0.2mM(final concentration,same below) oleic acid; Ber (Berberine, positive):1.0 × 10⁶ μg L−1 berberine; CTMS-H: 1.0 × 10⁶ μg L−1715 CTMS; CTMS-M: 1.0 × 10⁵ μg L−1 CTMS; CTMS-L:1.0 × 10⁴ μg L−1 CTMS; CCMS-H: 1.0 × 10⁶μg L−1CCMS; CCMS-M: 1.0 × 10⁵μg L−1 CCMS; CCMS-L:1.0 × 10⁴ μg L−1 CCMS. (###p < 0.001 when compared tothe control; *p < 0.05,**p < 0.01,***p < 0.001 when com-720 pared with the model).
