Fig. 2.

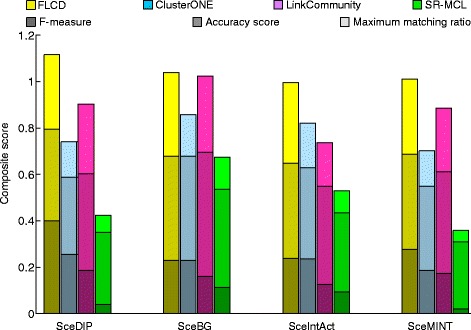
Comparison of all competing algorithms by MIPS reference dataset in terms of the composite scores. Shades of the same color indicate different evaluating scores. Each bar height reflects the value of the composite score

Comparison of all competing algorithms by MIPS reference dataset in terms of the composite scores. Shades of the same color indicate different evaluating scores. Each bar height reflects the value of the composite score