
Figure 2.
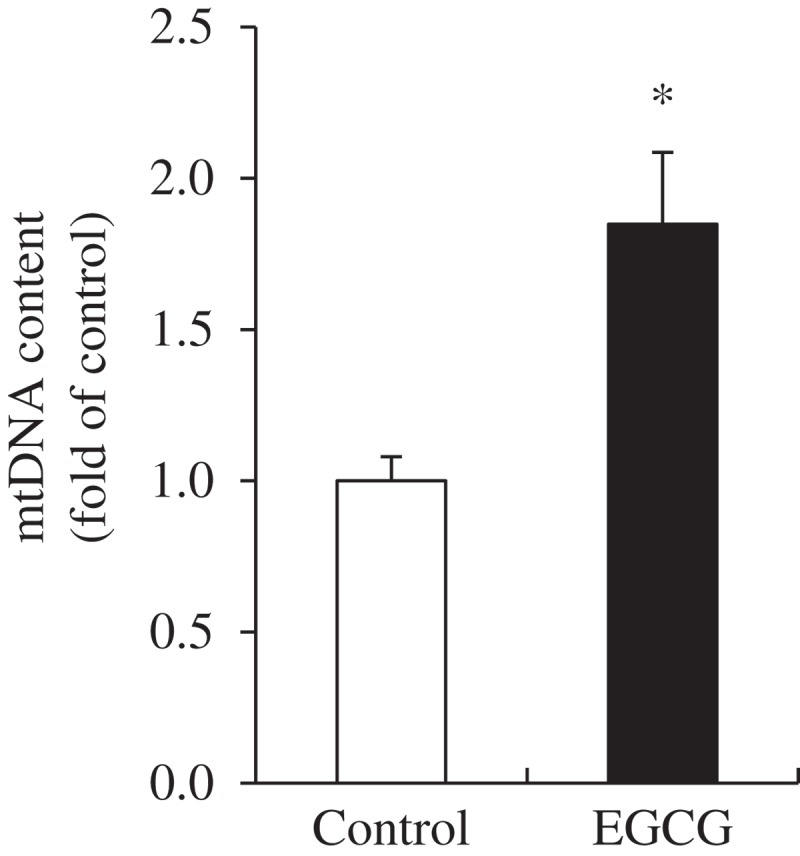
Mitochondrial DNA (mtDNA) content in brown adipose tissue of mice fed control or epigallocatechin-3-gallate (EGCG) diets for 8 weeks. Values for the EGCG group are expressed as the fold change compared with those for the control group (mean ± SEM, n = 6). *p < 0.05 vs control group. Control, high-fat diet; EGCG, 0.2% EGCG-supplemented high-fat diet.