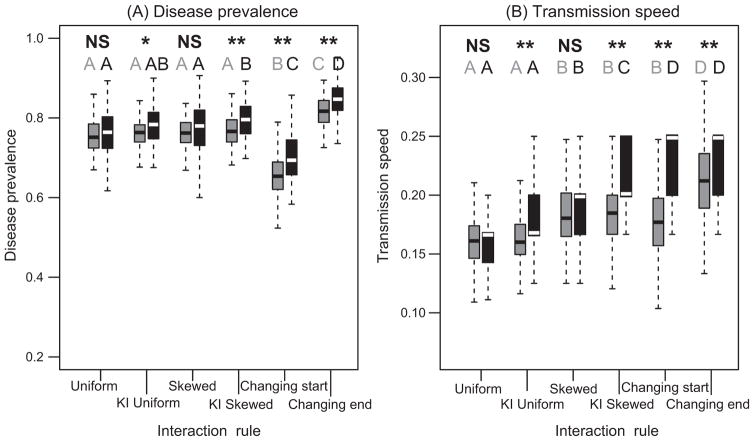
Figure 5.
Disease dynamics. A, Disease prevalence. B, Transmission speed. Boxplots represent 100 simulation runs for the various interaction rules and high persistence and low acquisition parameters. Gray boxes represent simulations in which generic individuals were the index case, and black boxes are simulations in which the keystone individual was the index case. Significant differences between these two types of index cases are indicated in boldface in the top row. A single asterisk indicates Pr < .05, and a double asterisk indicates Pr < .001. The first five boxplot pairs in each panel represent the first 20 time steps of the simulation for the various interaction rules, and the last pair of boxplots is for the last 20 time steps of the Changing interaction rule. Boxes that share a letter of the same color on the second row are not significantly different, according to a post hoc Tukey test.

