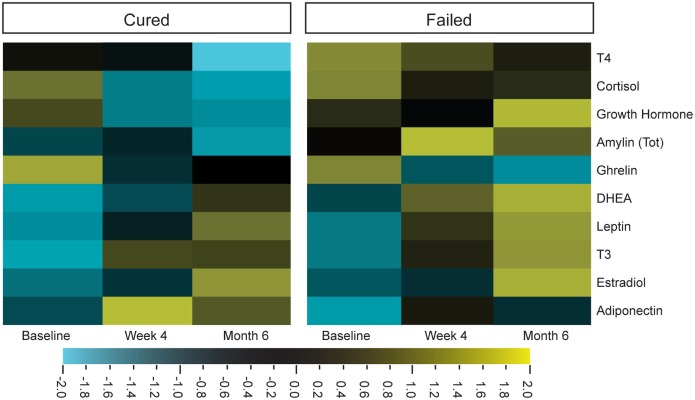
Figure 1.
Differential expression of plasma hormone concentrations before (baseline), during (week 4), and after tuberculosis treatment (month 6). Hormone concentrations, measured by Luminex (cortisol, T3, T4, ghrelin, leptin, and estradiol) and ELISA [dehydroepiandrosterone (DHEA), amylin (Tot), adiponectin, and growth hormone], were clustered according to group and time point (cured group n = 25 and failed group n = 10). Qlucore Omics explorer software was used to generate the heat maps around the mean hormone concentrations of the log-transformed data. Bright yellow indicates +2 (fourfold) upregulation from the mean (black) and bright blue indicates a −2 downregulation from the mean.

